Fig. 4
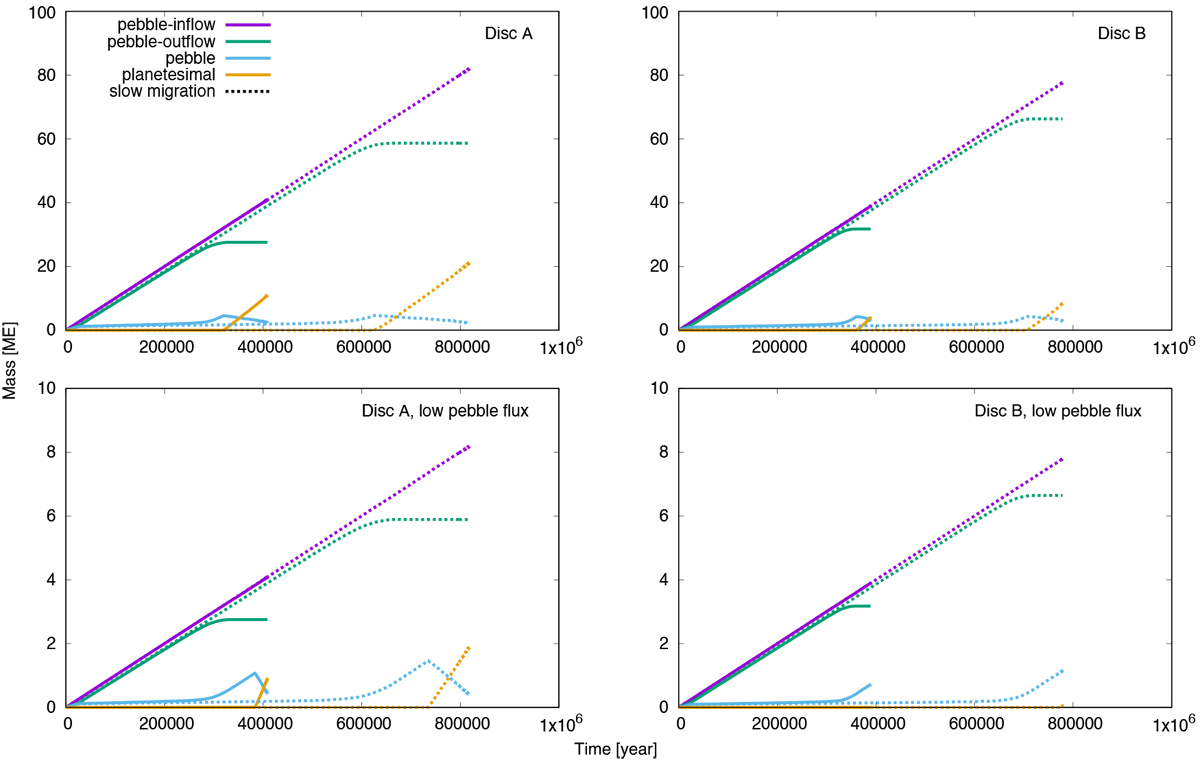
Distribution of solid mass with Discs A and B (left and right panels, respectively). The pebble mass fluxes of the upper and lower panels are Ṁpeb = 10−4 and 10−5 ME yr−1, respectively.The purple curves represent the cumulative mass of the pebbles flowing into the calculation area from the outside of 50 au. The green curves represent the cumulative mass of the pebbles flowing out from the calculation area through the orbit of the planet. The light blue and orange curves indicate the total mass of the pebbles and planetesimals within the calculation area at each time, respectively. The dotted curves indicate those with the half migration speed.
Current usage metrics show cumulative count of Article Views (full-text article views including HTML views, PDF and ePub downloads, according to the available data) and Abstracts Views on Vision4Press platform.
Data correspond to usage on the plateform after 2015. The current usage metrics is available 48-96 hours after online publication and is updated daily on week days.
Initial download of the metrics may take a while.