Fig. 1
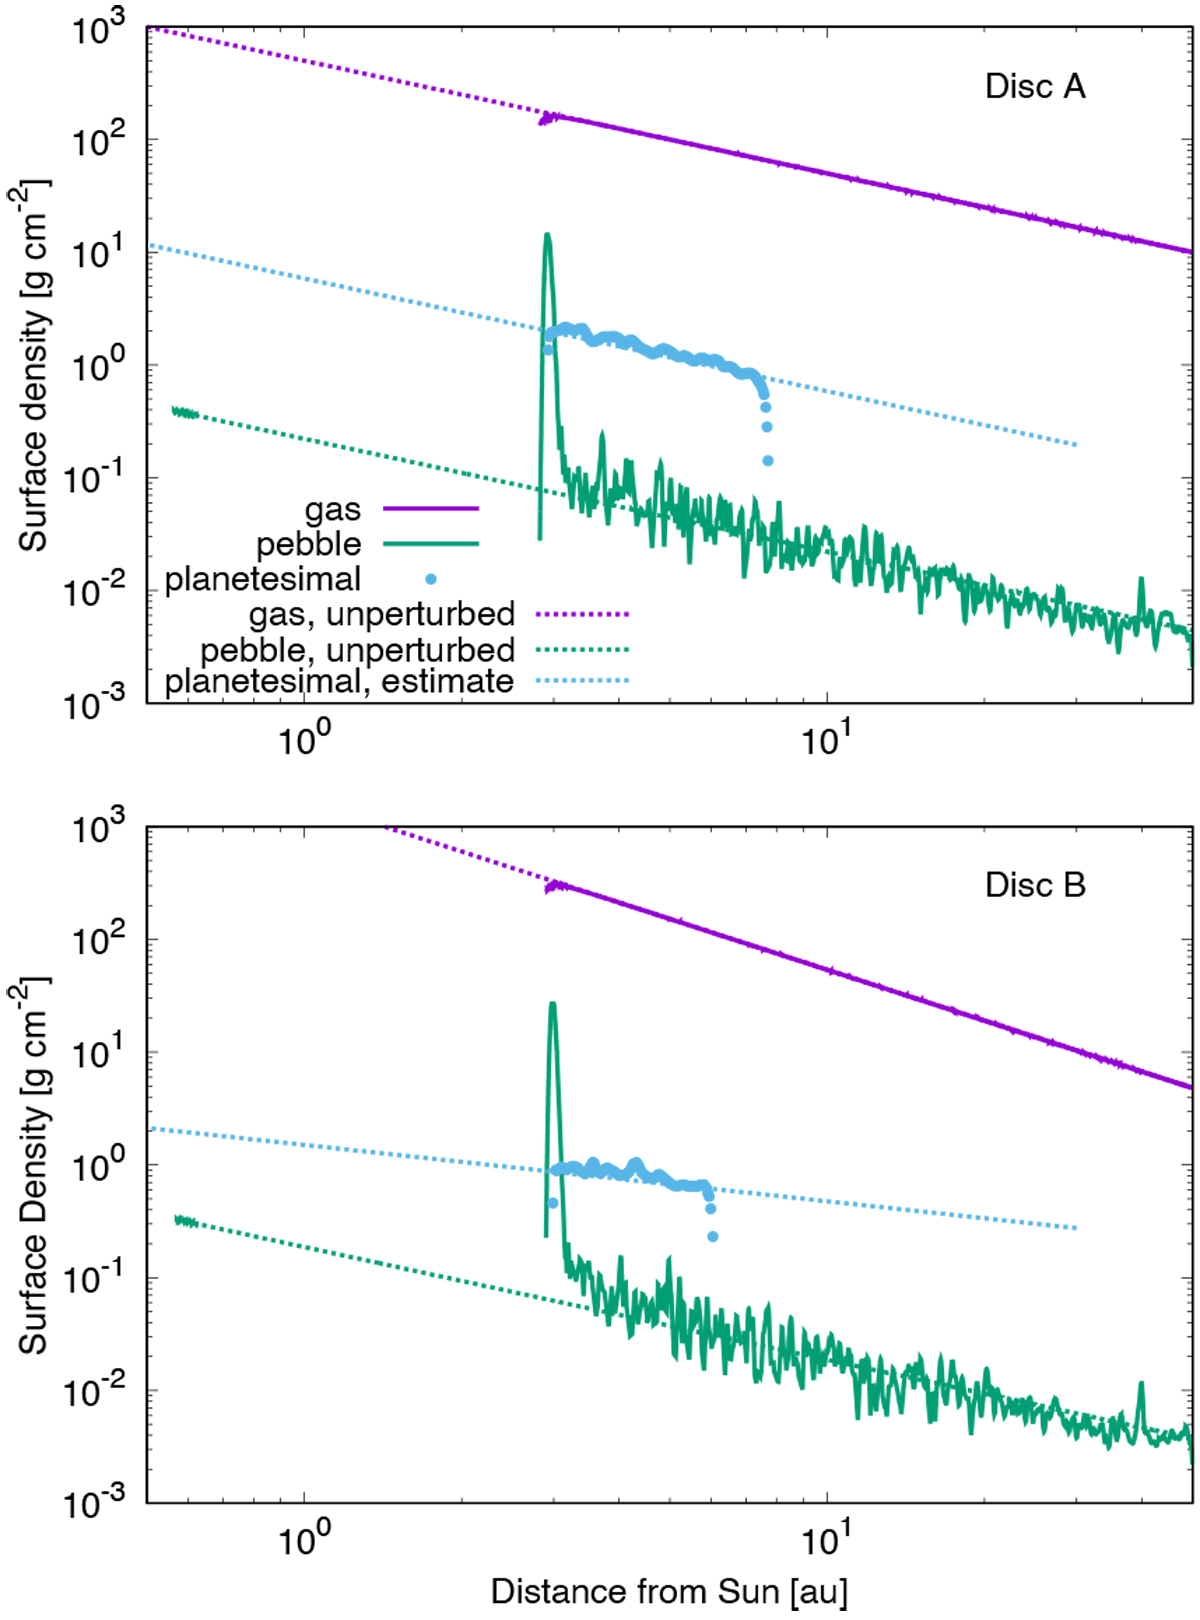
Gas, pebble, and planetesimal surface density. The purple, green, and light blue solid plots represent these profiles, respectively, with Discs A (upper panel) and B (lower panel) at t = 3.8 × 10⁵ yr. The pebble flux is Ṁpeb = 10−4 ME yr−1 and the migration speed is the normal one. The purple, green, and light blue dotted lines represent the unperturbed gas surface density (Eq. (19)), the unperturbed pebble surface density (Eq. (10), and the estimated planetesimal surface density (Eq. (21)), respectively.
Current usage metrics show cumulative count of Article Views (full-text article views including HTML views, PDF and ePub downloads, according to the available data) and Abstracts Views on Vision4Press platform.
Data correspond to usage on the plateform after 2015. The current usage metrics is available 48-96 hours after online publication and is updated daily on week days.
Initial download of the metrics may take a while.