Fig. A.1.
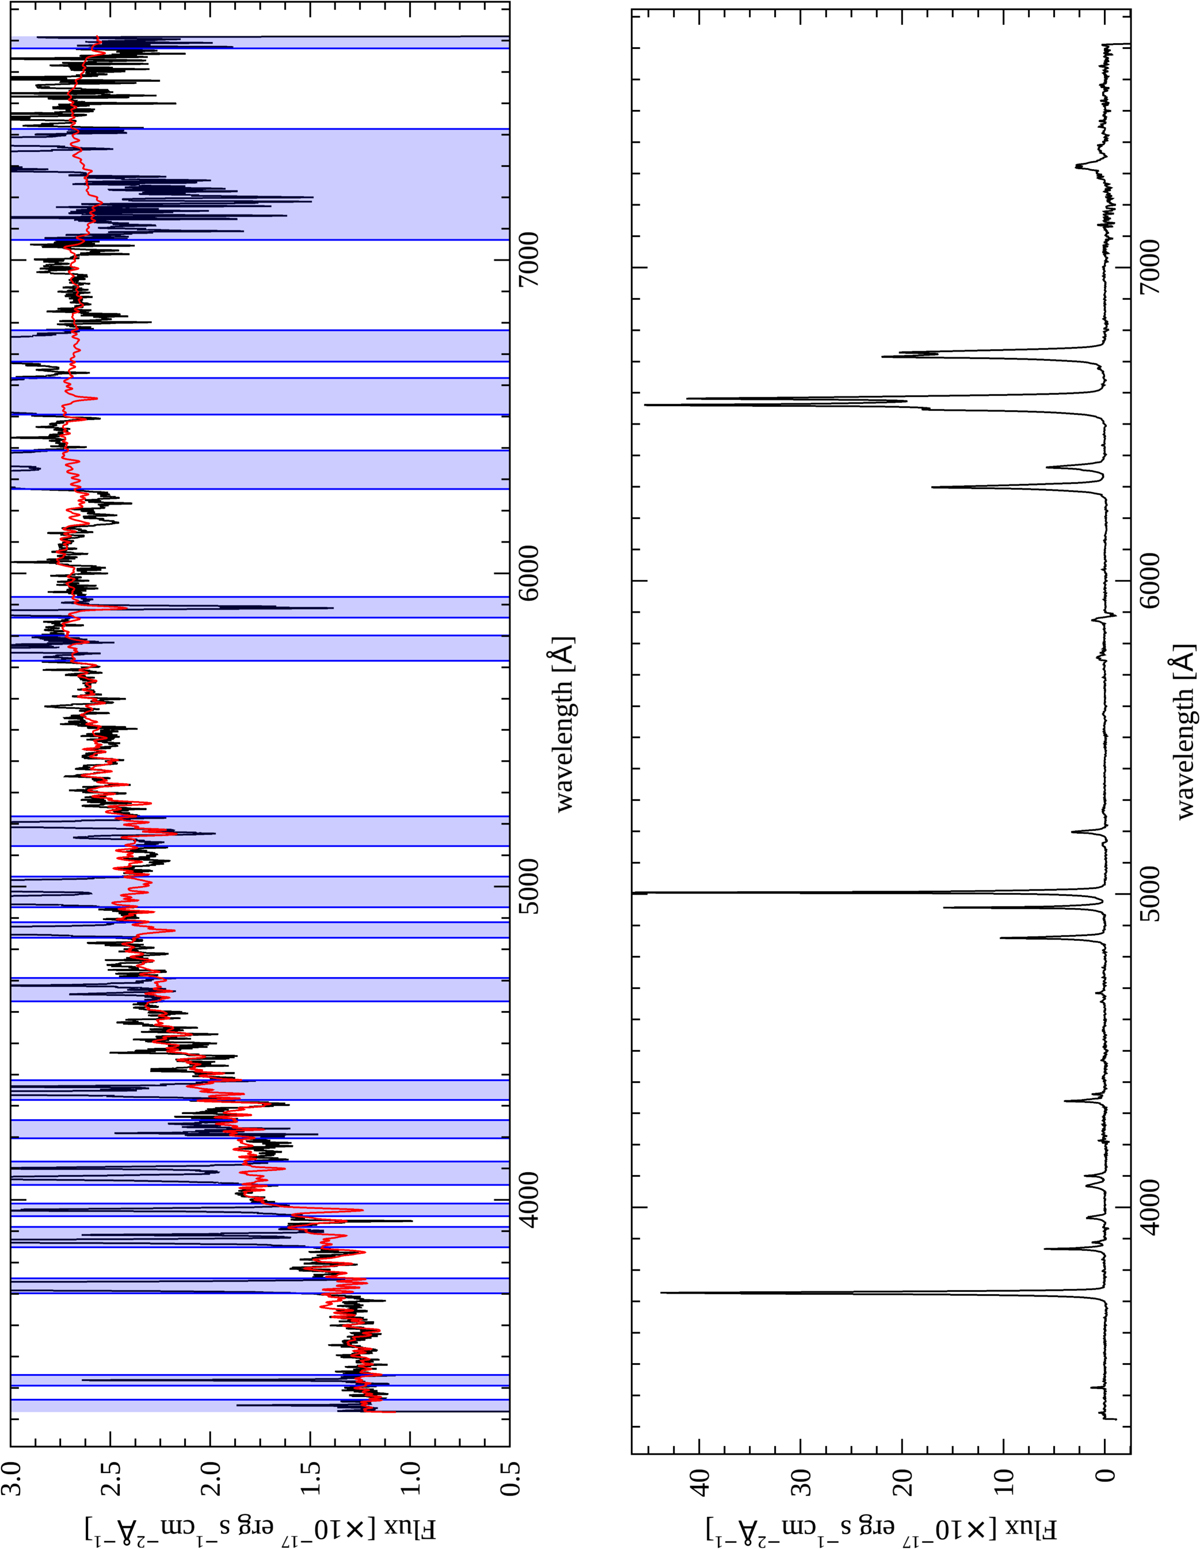
PKS 0023–26: Upper panel: UVB+VIS Nuclear spectrum (black solid line) and best-fit model (red solid line) for the continuum emission, regions of the spectrum corresponding to masked emission lines are indicated in blue. Lower panel: residual spectrum after subtraction of the stellar continuum showing the emission lines associated with the warm ionised gas. Wavelengths are plotted in Å, and the flux scale is given in units of 1017 erg s−1 cm−2 Å−1. We note that plots with detailed fits to the emission lines in this source are presented in the main text.
Current usage metrics show cumulative count of Article Views (full-text article views including HTML views, PDF and ePub downloads, according to the available data) and Abstracts Views on Vision4Press platform.
Data correspond to usage on the plateform after 2015. The current usage metrics is available 48-96 hours after online publication and is updated daily on week days.
Initial download of the metrics may take a while.