Fig. 7.
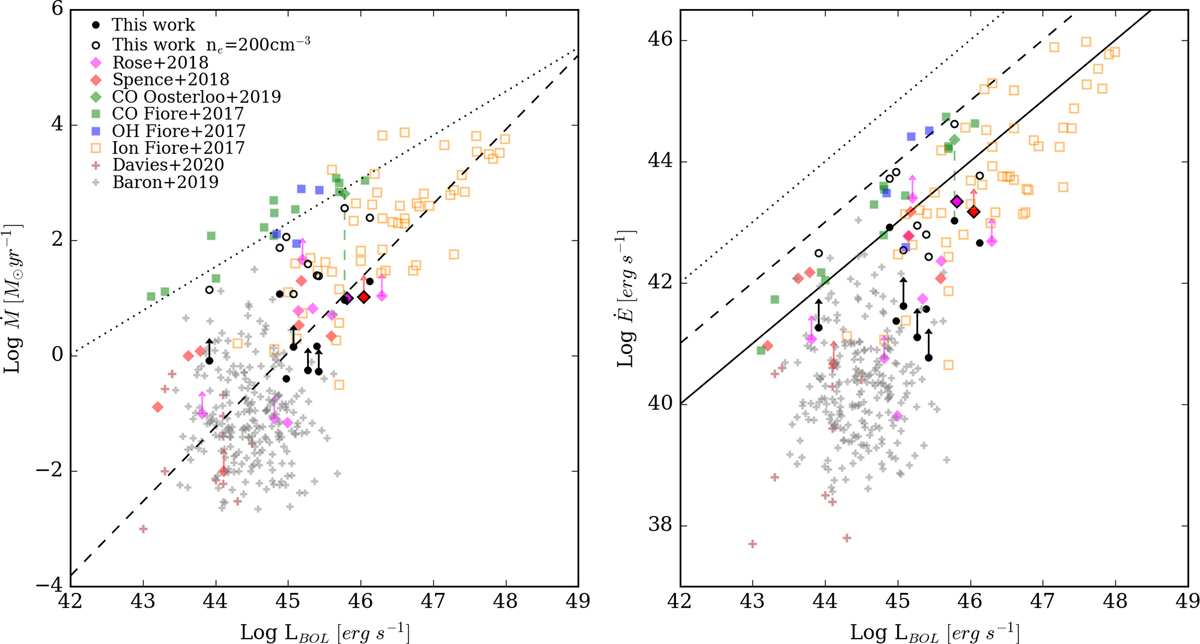
Mass outflow rate (left panel) and kinetic power of the outflow (right panel) as a function of the AGN bolometric luminosity for our sample (black points) and the comparison samples (see legend in the upper left of the left panel). To distinguish them from the rest of the comparison sample, the markers of the two ULIRGs hosting a compact radio source have a black edge colour. To enable a fair comparison with the ionised gas outflows of Fiore et al. (2017) we also assumed an outflow gas density of ne = 200 cm−3 for all our targets (black empty circles). The CO outflow detected in PKS 1549–79 by Oosterloo et al. (2019) has been also included in this plot using our estimate of the source LBOL, a green dashed vertical line connects the warm ionised and the molecular outflow Ṁ and Ė values for this object to highlight the differences between the outflows properties in the two gas phases. The dotted and dashed black lines in the left panel represent the best fit relations found by Fiore et al. (2017) for the molecular gas and ionised gas outflows, respectively. The dotted, dashed and solid black lines in the right panel mark the correlations Ė = 1, 0.1, 0.01 LBOL.
Current usage metrics show cumulative count of Article Views (full-text article views including HTML views, PDF and ePub downloads, according to the available data) and Abstracts Views on Vision4Press platform.
Data correspond to usage on the plateform after 2015. The current usage metrics is available 48-96 hours after online publication and is updated daily on week days.
Initial download of the metrics may take a while.