Fig. 5.
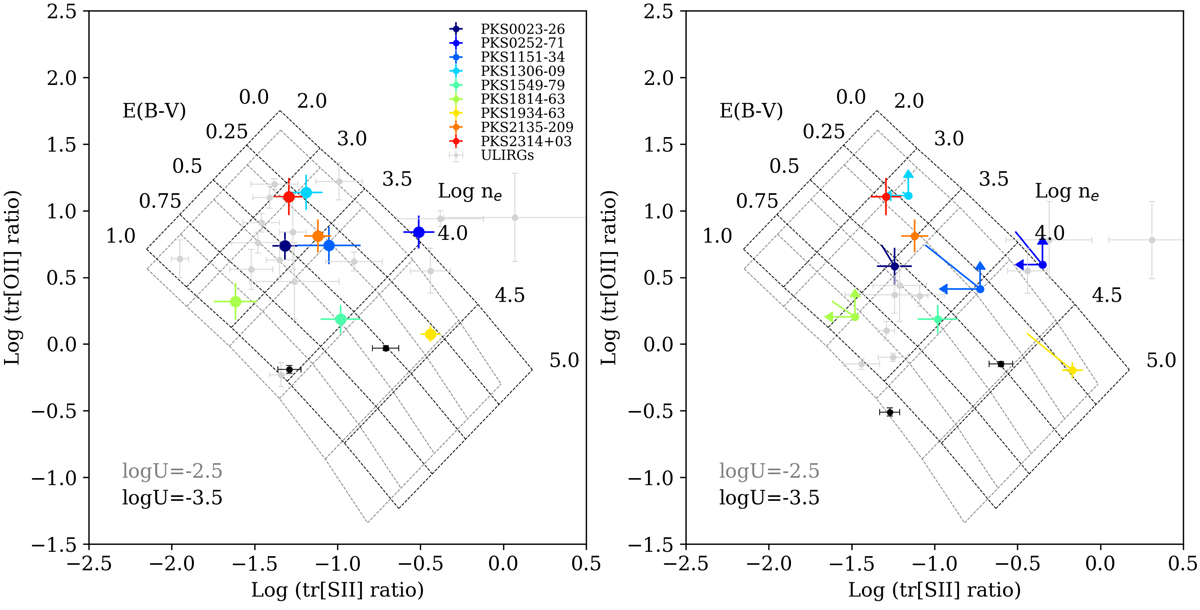
Location of our targets in the density diagnostic diagram (DDD) using the logarithm of the tr[O II] = [O II](3727+3729)/(7318+7319+7330+7331) and of the tr[S II] = [S II](4068+4076)/(6716+6731) line ratios. Error bars have been estimated by propagating the line flux errors while upper/lower limits have been assigned as described in the text; different sources in our sample are marked with different colours as indicated by the legend in the upper right corner of the left panel. For comparison, the DDD also includes the results obtained for the ULIRGs studied by Spence et al. (2018) and Rose et al. (2018) (thin light grey points), two of which also host a compact radio source (thin black points). AGN photoionisation grid models for gas with solar metallicity and two ionisation parameters – log U = −2.5 (light grey colour) and log U = −3.5 (black colour) – are shown with dotted lines. The model grids have been created by fixing the gas metallicity and ionisation parameter while varying the electron density in the interval ne = 100 − 105 cm−3 (from top left to bottom right) and the reddening in the interval E(B − V) = 0 − 1 mag (from top right to bottom left). Left panel: DDD showing the line ratios based on the total line fluxes. Right panel: DDD showing the outflows line ratios determined from the integrated fluxes of broad components of the emission lines. For each galaxy in our sample a solid line connects the line ratios of the total (as shown in the left panel) and outflowing gas emission.
Current usage metrics show cumulative count of Article Views (full-text article views including HTML views, PDF and ePub downloads, according to the available data) and Abstracts Views on Vision4Press platform.
Data correspond to usage on the plateform after 2015. The current usage metrics is available 48-96 hours after online publication and is updated daily on week days.
Initial download of the metrics may take a while.