Fig. 4.
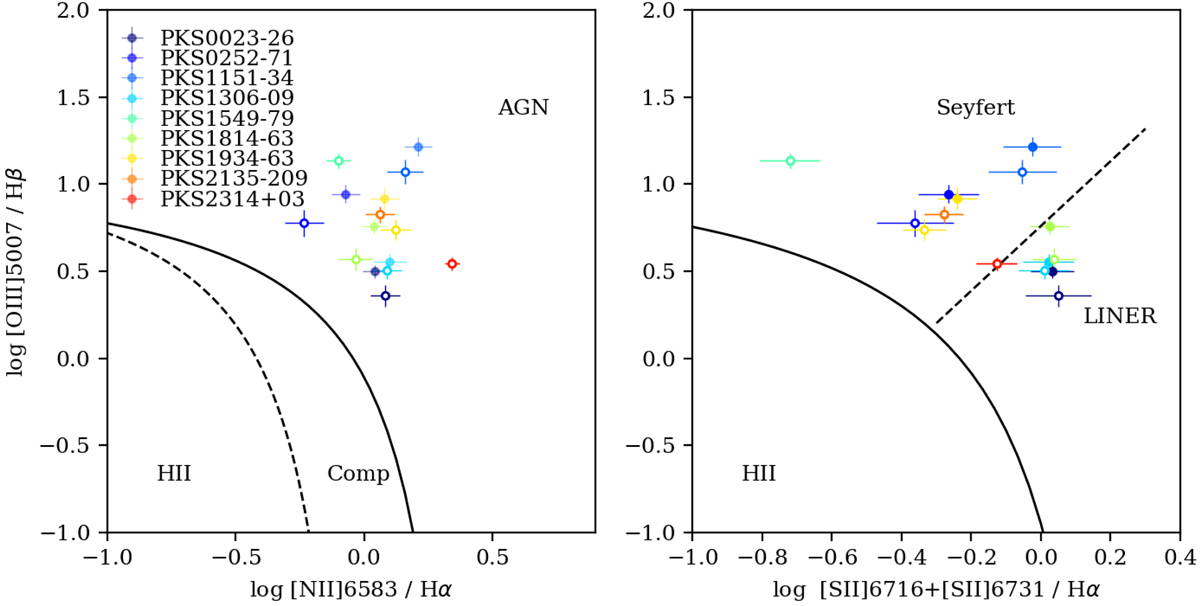
Locations of our targets in the [O III]/Hβ vs [N II]6583/Hα and [O III]/Hβ vs [S II]6716,31/Hα BPT diagrams. Filled circles mark the line ratios obtained from total line fluxes while empty circles are related to the line emission of the broad components only. The solid line in both panels is the Kewley et al. (2001) maximum starburst line. The dashed line in the left panel is the semi-empirical Kauffmann et al. (2003) line and has bee used together with the Kewley et al. (2001) line to separate between line ratios due to photoionisation from stars (HII), AGN or a mixture of both (Comp). The dashed line in the right panel is the Kewley et al. (2006) line separating the AGN between Seyferts and LINERS.
Current usage metrics show cumulative count of Article Views (full-text article views including HTML views, PDF and ePub downloads, according to the available data) and Abstracts Views on Vision4Press platform.
Data correspond to usage on the plateform after 2015. The current usage metrics is available 48-96 hours after online publication and is updated daily on week days.
Initial download of the metrics may take a while.