Fig. 3.
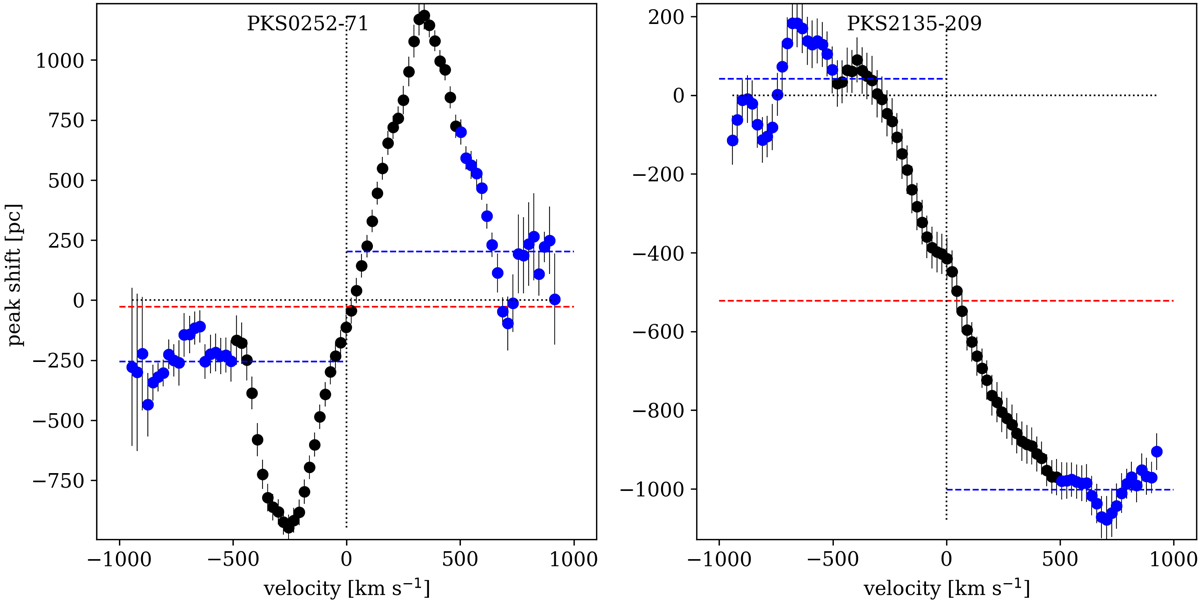
Position-velocity diagrams obtained by applying the spectro-astrometry technique to the [O III]λ5007 Å line in the slit spectra of PKS 0252–71 and PKS 2135–209. The diagrams show the position of the fitted centroids of the [O III]λ5007 Å emission line spatial profiles, expressed as offsets in parsecs from the host galaxy centre, as a function of velocity measured with respect to the [O III]λ5007 Å rest-frame velocity. The black dotted vertical and horizontal lines mark the zero point of the two axes. The blue dashed lines mark the error weighted mean position of the [O III] spatial profiles offsets at v < 500 km s−1 and at v > 500 km s−1 (shown in blue), while the red dashed line marks their average.
Current usage metrics show cumulative count of Article Views (full-text article views including HTML views, PDF and ePub downloads, according to the available data) and Abstracts Views on Vision4Press platform.
Data correspond to usage on the plateform after 2015. The current usage metrics is available 48-96 hours after online publication and is updated daily on week days.
Initial download of the metrics may take a while.