Fig. C.1.
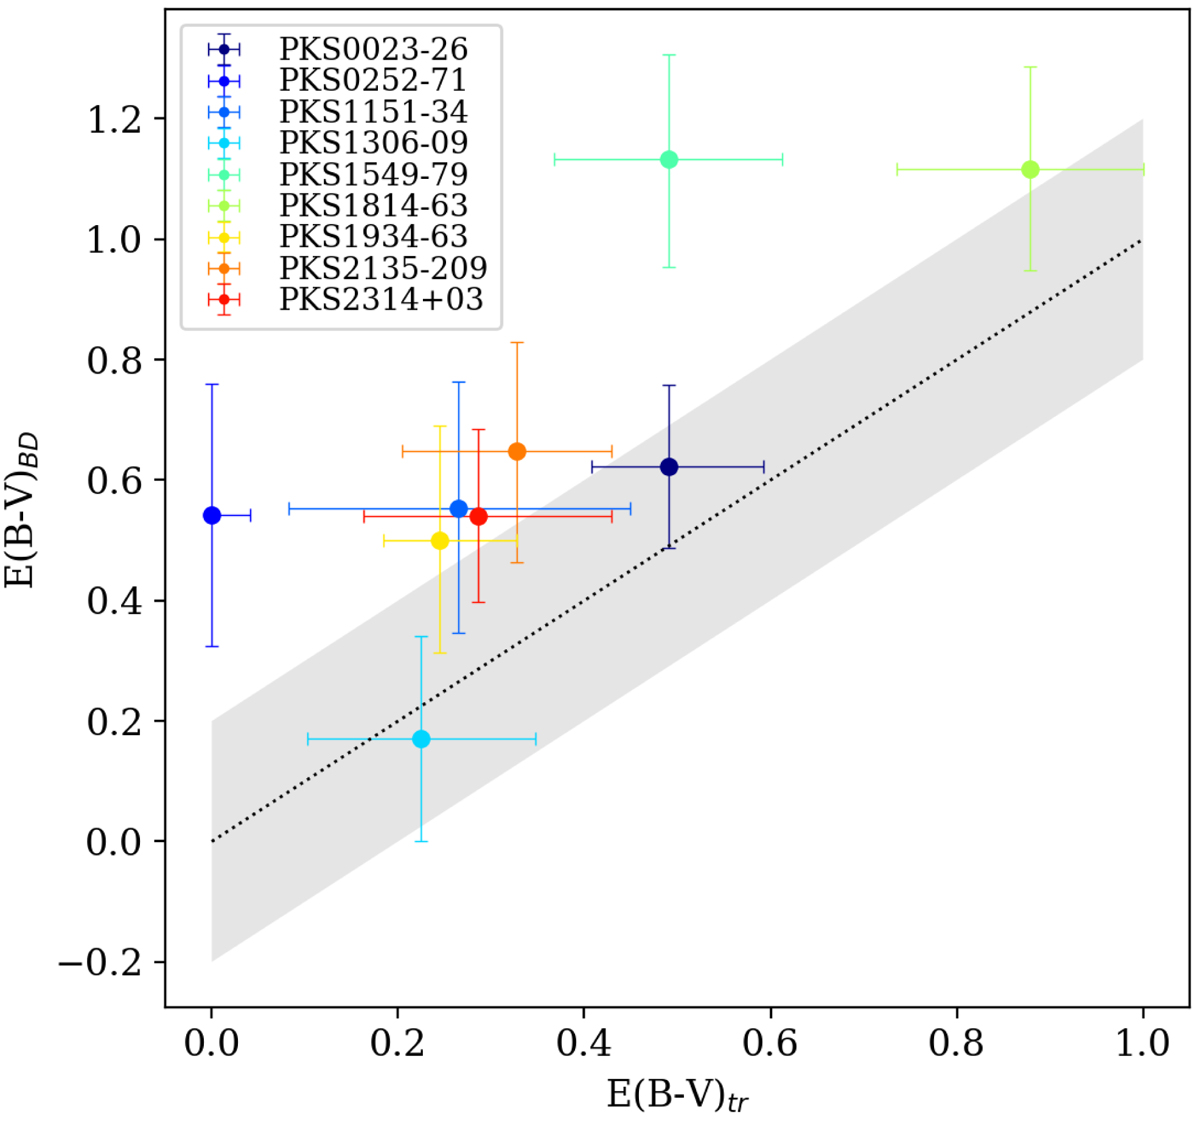
Comparison between the gas reddening estimated using the DDD presented in Fig. 5 (E(B − V)tr) and the Hα/Hβ Balmer decrement (E(B − V)BD). Different galaxies have different colours following the convention showed in the legend in upper left part. The dotted line marks the 1:1 relation and the shaded area a scatter of 0.2 in E(B − V).
Current usage metrics show cumulative count of Article Views (full-text article views including HTML views, PDF and ePub downloads, according to the available data) and Abstracts Views on Vision4Press platform.
Data correspond to usage on the plateform after 2015. The current usage metrics is available 48-96 hours after online publication and is updated daily on week days.
Initial download of the metrics may take a while.