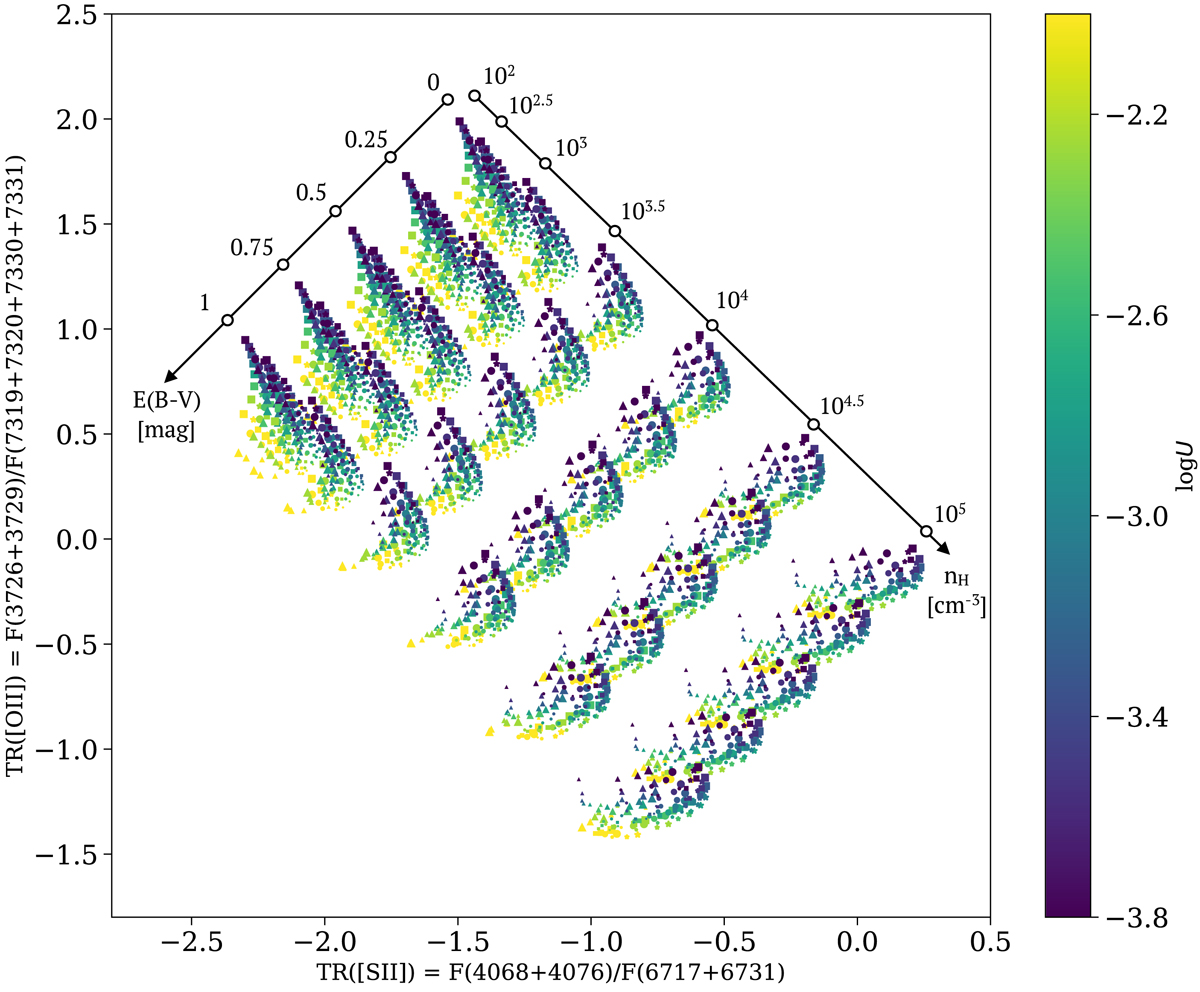
Fig. B.1.

Predicted auroral [OII] and trans-auroral [SII] line ratios for the 896 models considered in this work. The hydrogen number density ranges from 102 cm−3 to 105 cm−3, and the reddening ranges from E(B − V) = 0 mag to E(B − V) = 1 mag, both of which are indicated with arrows in the diagram. The colour of the markers represents the ionisation parameter, where log U = −3.8 is marked with purple and log U = −2 is marked with yellow. The size of the markers represents the gas metallicity, where the smallest markers correspond to 0.5 Z⊙ and the largest correspond to 2 Z⊙. The shapes of the markers represent different shapes of the ionising SED, where squares, stars, circles, and triangles correspond to SEDs with a mean energy of ionising photon of 2.56, 2.65, 3.15, and 4.17 Ryd, respectively. See text for additional details about the models.
Current usage metrics show cumulative count of Article Views (full-text article views including HTML views, PDF and ePub downloads, according to the available data) and Abstracts Views on Vision4Press platform.
Data correspond to usage on the plateform after 2015. The current usage metrics is available 48-96 hours after online publication and is updated daily on week days.
Initial download of the metrics may take a while.


