Fig. 2.
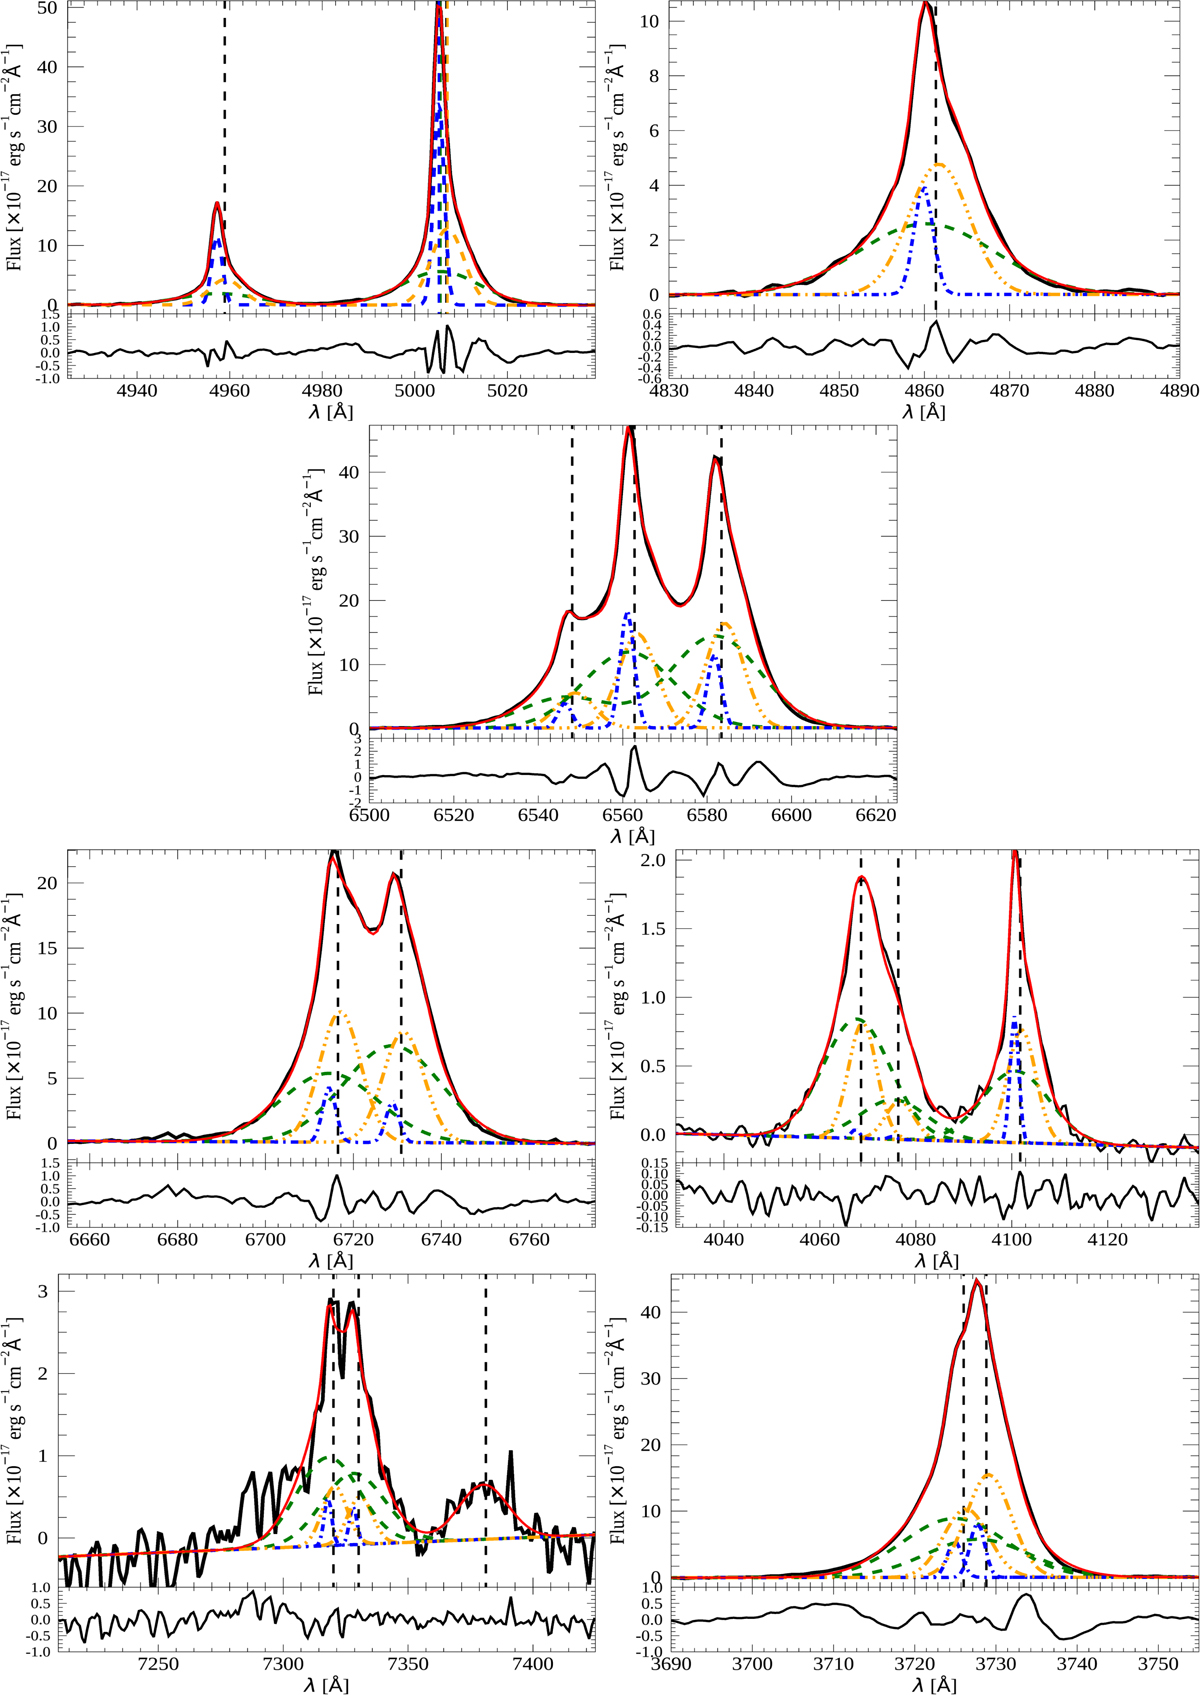
Emission-line profiles for PKS 0023–26: First row: [O III]λλ4958,5007 Å (left panel) and Hβ line (right panel) fits. Second row: Hα + [N II]λλ6548,84 Å line fits. Third row: [S II]λλ6717,31 Å (left panel) and [S II]λλ4069,76 Å (right panel) trans-auroral line fits. The latter fit includes also the Hδ line. Fourth row: [O II]λλ7319,30 Å (left panel) and [O II]λλ3726,29 Å (right panel) trans-auroral line fits. The former fit also includes the [O II]λ7381 Å line which has been modelled with a single Gaussian component. In each of the sub-figures the upper panel shows the best fit (red solid line) of the observed spectrum (black solid line) while the lower panel shows the residuals of the fit. The different kinematic components used for the fit of each emission line are showed with different colours and line styles. In the case of doublets where flux ratios have been fixed (i.e. the [O III]λλ4958,5007 Å and the [N II]λλ6548,84 Å) we show the total profile of each doublet kinematic component. The vertical dashed lines marks the rest-frame wavelength of the fitted emission lines. Wavelengths are plotted in Å, and the flux scale is given in units of 10−17 erg s−1 cm−2 Å−1.
Current usage metrics show cumulative count of Article Views (full-text article views including HTML views, PDF and ePub downloads, according to the available data) and Abstracts Views on Vision4Press platform.
Data correspond to usage on the plateform after 2015. The current usage metrics is available 48-96 hours after online publication and is updated daily on week days.
Initial download of the metrics may take a while.