Fig. 1.
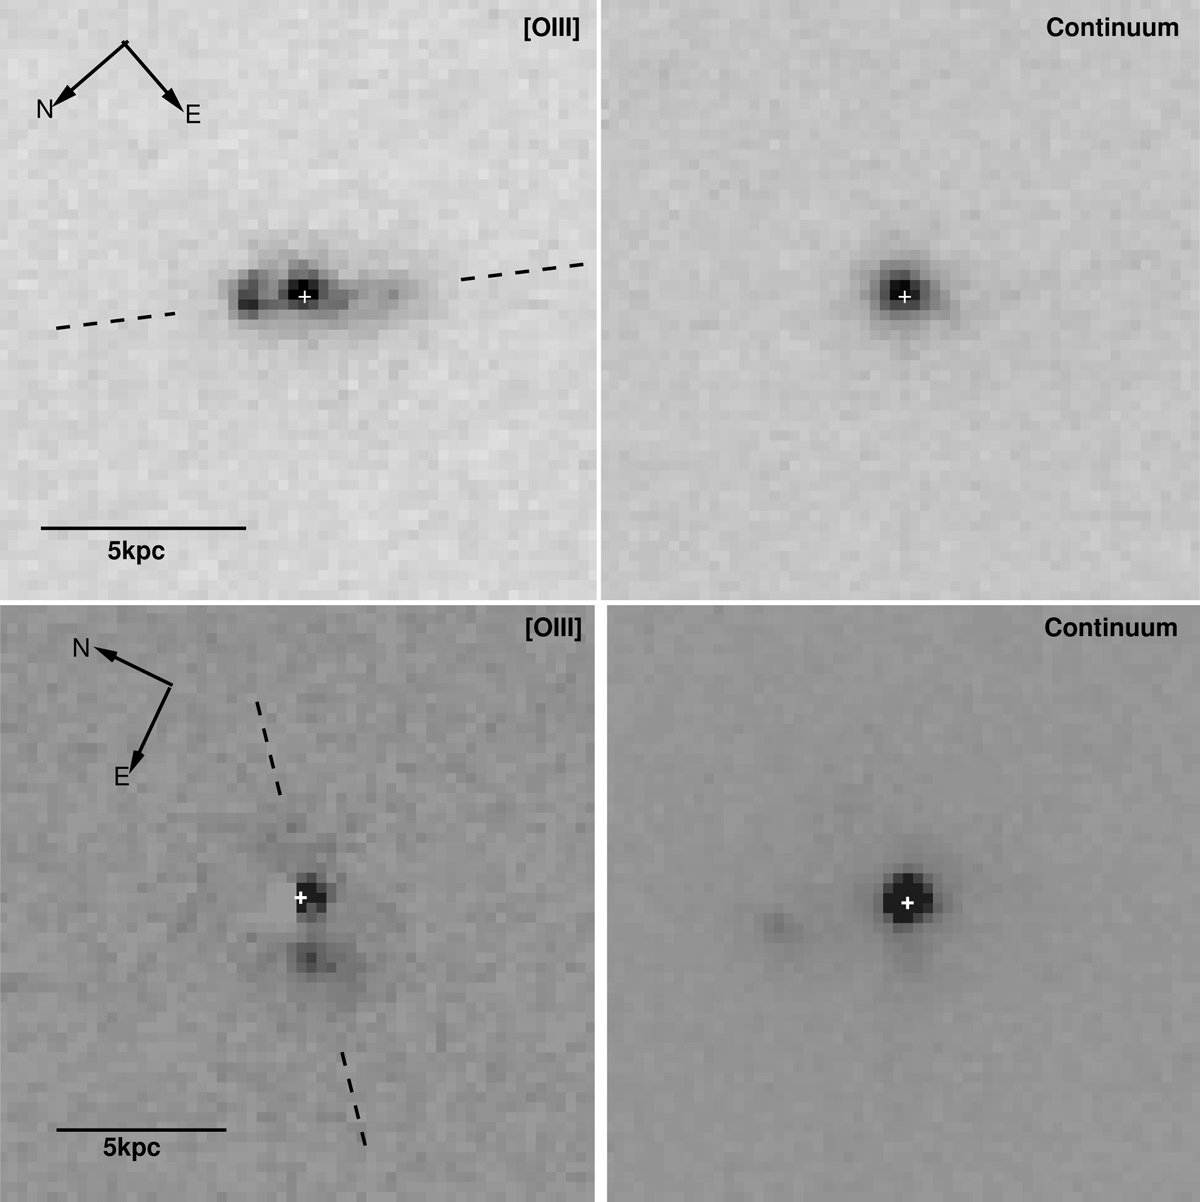
HST ACS/WFC images of PKS 0023–26 (top) and PKS 1306–09 (bottom). Left-hand panels: narrow-band [O III] images, right-hand panels: intermediate-band continuum images. In each case, the dashed line shows the direction of the radio axis. We note that in both cases, the brightest extended [O III] structures are closely aligned in angle with the radio axes (within ∼10°).
Current usage metrics show cumulative count of Article Views (full-text article views including HTML views, PDF and ePub downloads, according to the available data) and Abstracts Views on Vision4Press platform.
Data correspond to usage on the plateform after 2015. The current usage metrics is available 48-96 hours after online publication and is updated daily on week days.
Initial download of the metrics may take a while.