Free Access
Fig. 7.
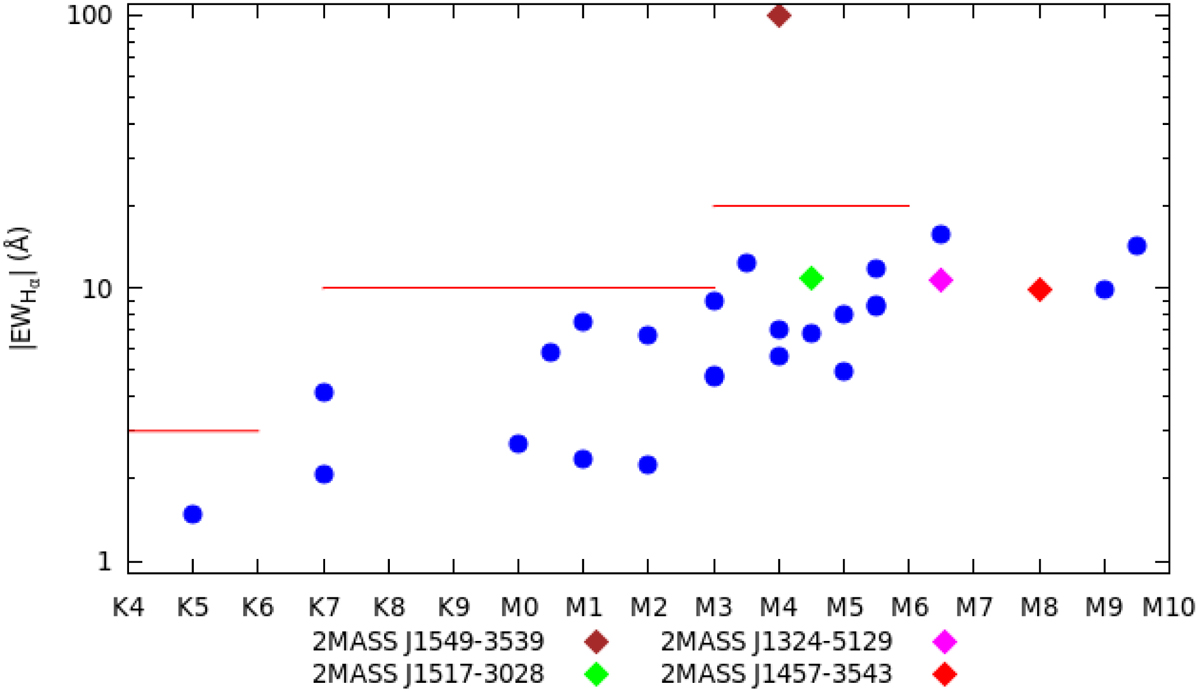
EWHα vs. SpT of our targets with Hα emission (diamonds) along with the objects studied by Manara et al. (2013, blue dots). The red horizontal lines represent the thresholds between nonaccreting and accreting objects for different SpT ranges according to White & Basri (2003).
Current usage metrics show cumulative count of Article Views (full-text article views including HTML views, PDF and ePub downloads, according to the available data) and Abstracts Views on Vision4Press platform.
Data correspond to usage on the plateform after 2015. The current usage metrics is available 48-96 hours after online publication and is updated daily on week days.
Initial download of the metrics may take a while.