Fig. 1.
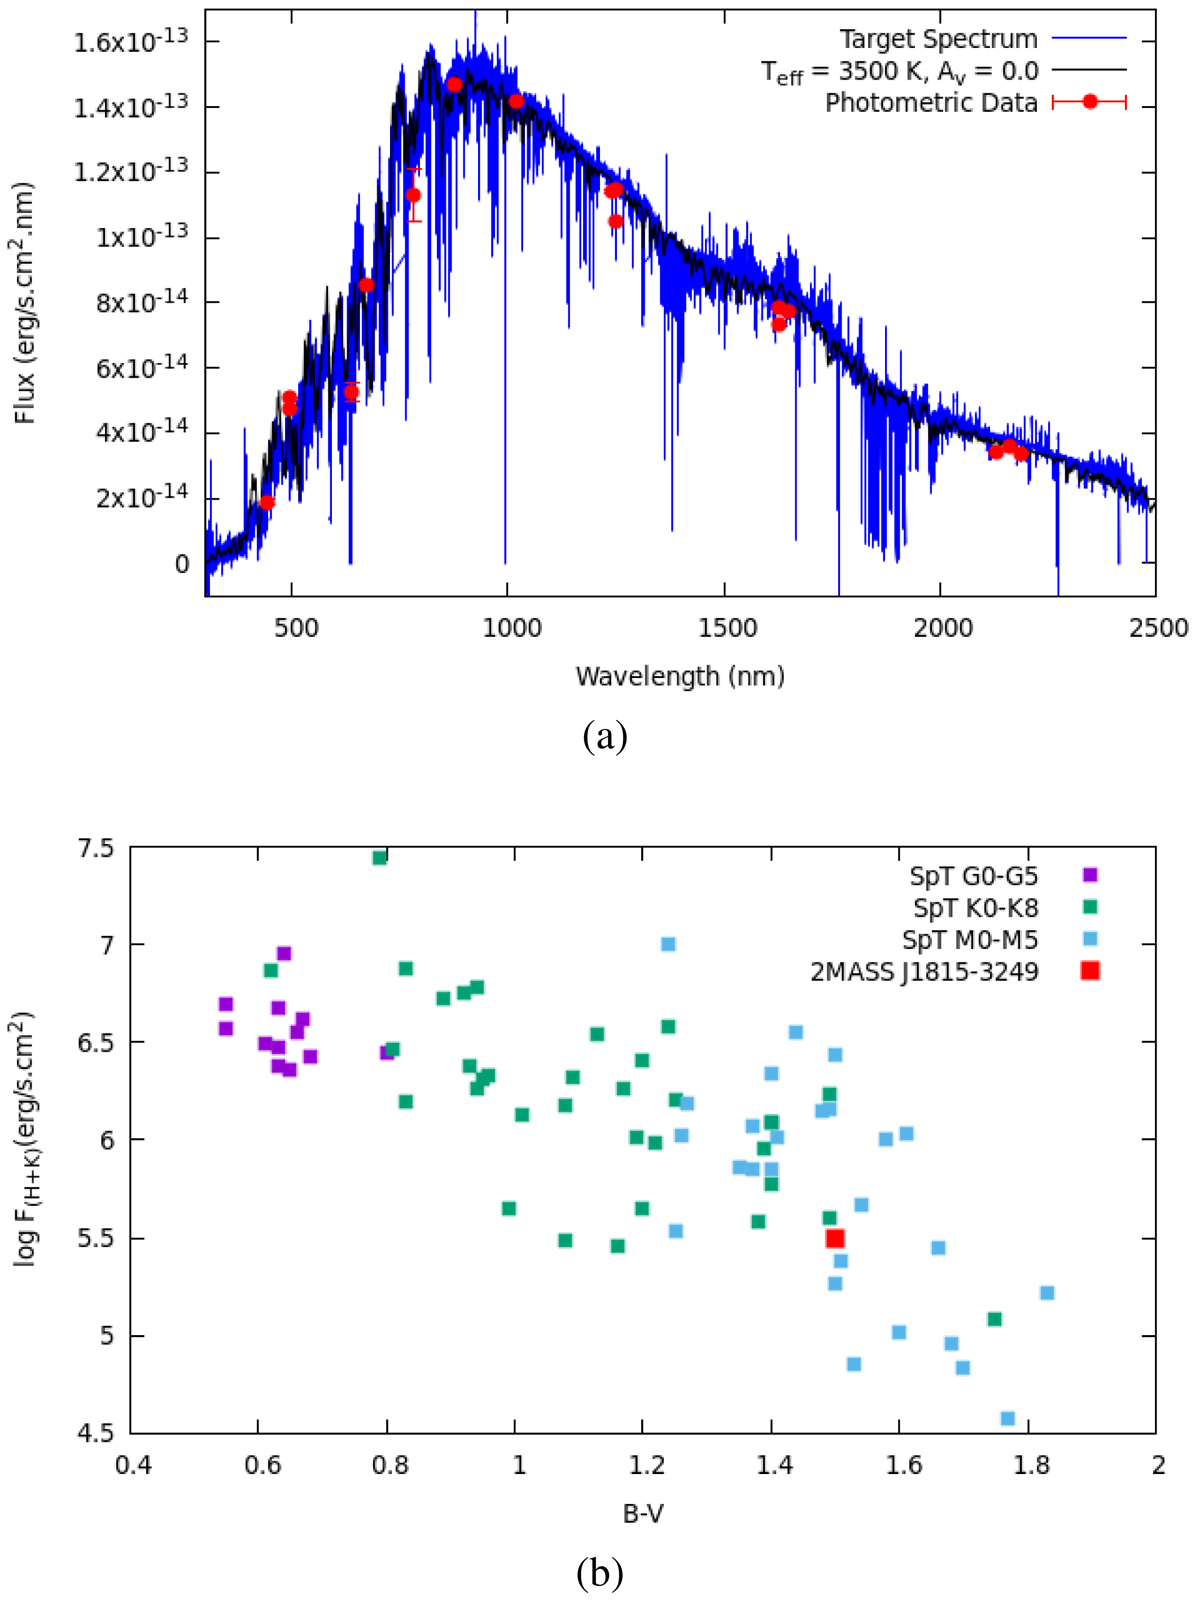
Panel a: spectrum of 2MASS J1815-3249 (blue) together with a BT-Settl model (black) fitted to the spectrum assuming zero extinction. Panel b: total excess emission in Ca II H and K vs. color index B-V of objects studied by López-Santiago et al. (2010) and Martinez-Arnáiz et al. (2011) including 2MASS J1815-3249, shown as a red square.
Current usage metrics show cumulative count of Article Views (full-text article views including HTML views, PDF and ePub downloads, according to the available data) and Abstracts Views on Vision4Press platform.
Data correspond to usage on the plateform after 2015. The current usage metrics is available 48-96 hours after online publication and is updated daily on week days.
Initial download of the metrics may take a while.