Fig. 9.
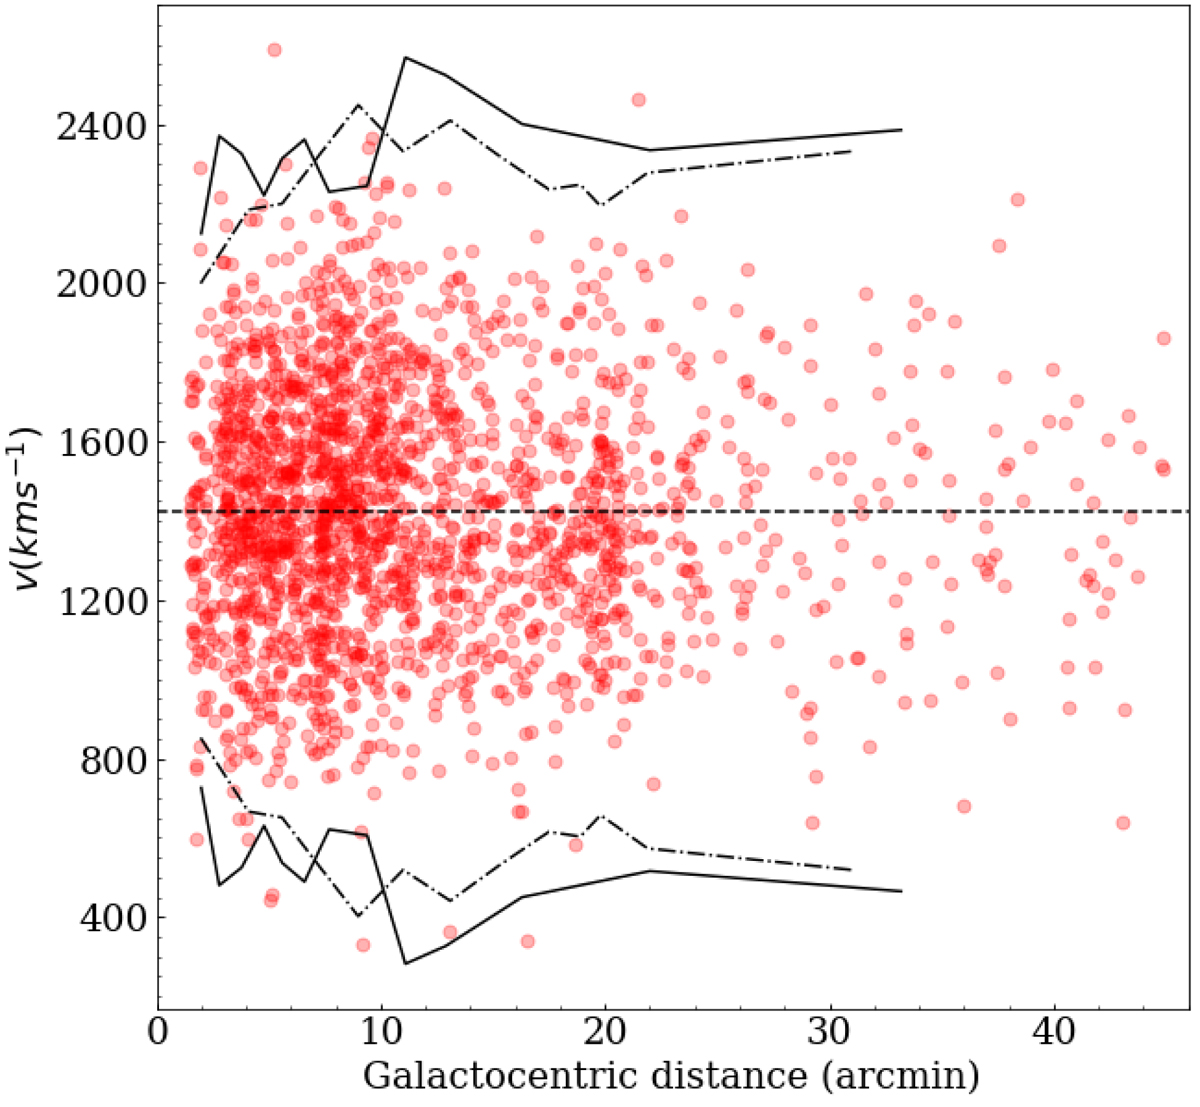
Phase space of one Monte Carlo simulation. On the x-axis, we plot the distance from NGC 1399 in arcminutes, and on the y-axis we plot the velocities of the points in km s−1. The continuous solid and dashed-dotted lines represent the ±3σp profiles of the GCs and PNe, respectively, extracted from P+18 (their Fig. 9). The dashed black horizontal line represents the systemic velocity of NGC 1399 (1425 km s−1).
Current usage metrics show cumulative count of Article Views (full-text article views including HTML views, PDF and ePub downloads, according to the available data) and Abstracts Views on Vision4Press platform.
Data correspond to usage on the plateform after 2015. The current usage metrics is available 48-96 hours after online publication and is updated daily on week days.
Initial download of the metrics may take a while.