Free Access
Fig. 1.
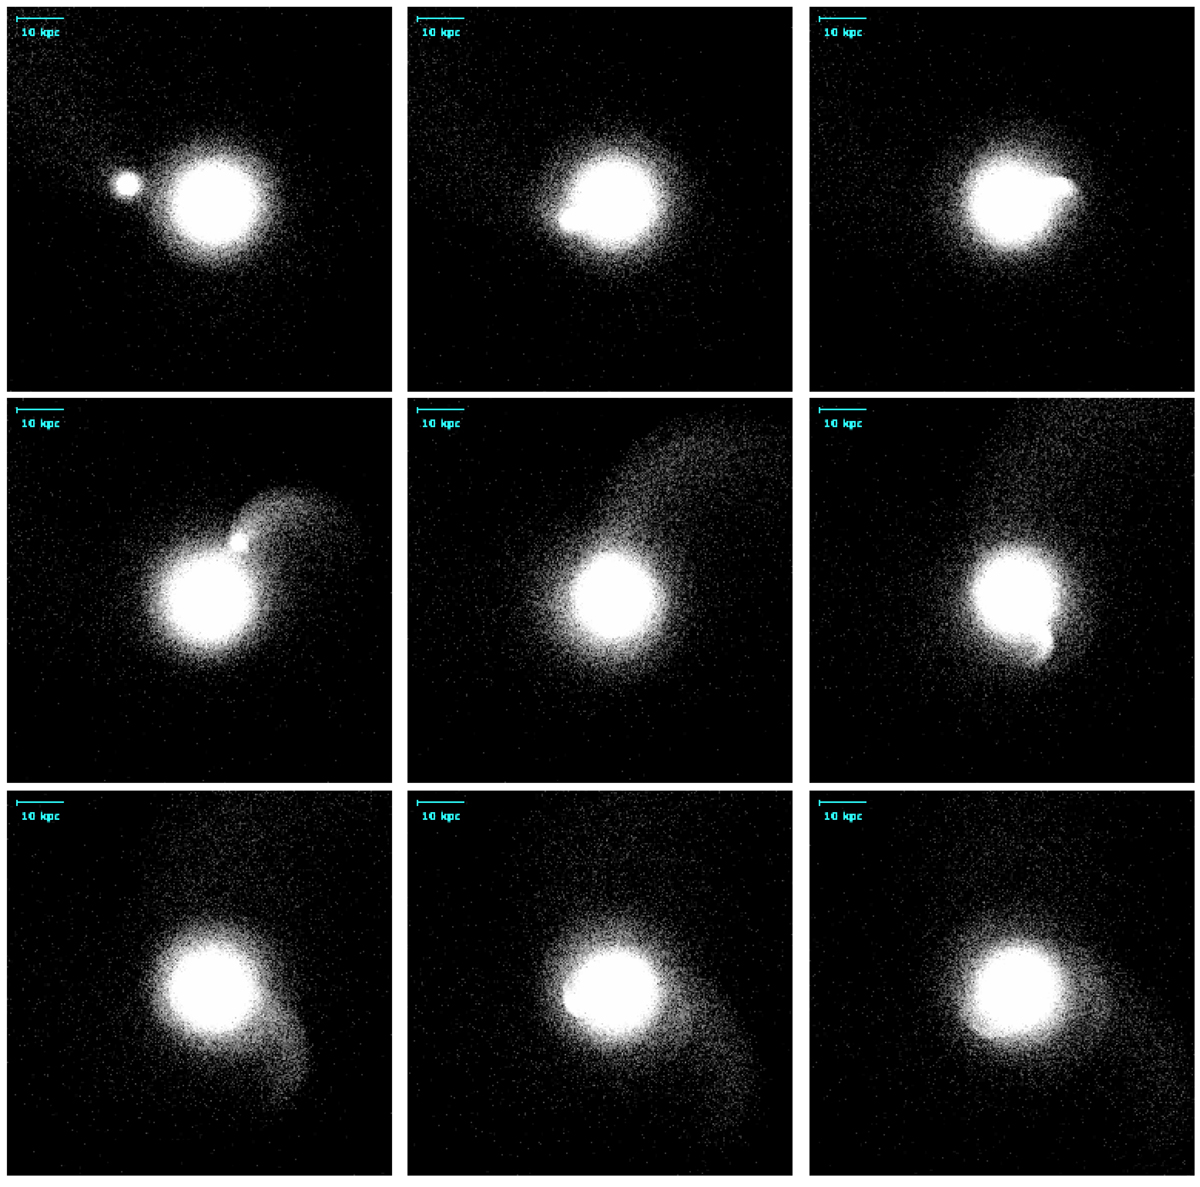
Snapshots of gE0-dE0 encounter, from 1850 Myr (top left) up to 2250 Myr (bottom right) after the beginning of the simulation, and separated by steps of 50 Myr. To test COSTA, we use the configuration at the center of the image, which is temporarily located at 2050 Myr after the start of the encounter.
Current usage metrics show cumulative count of Article Views (full-text article views including HTML views, PDF and ePub downloads, according to the available data) and Abstracts Views on Vision4Press platform.
Data correspond to usage on the plateform after 2015. The current usage metrics is available 48-96 hours after online publication and is updated daily on week days.
Initial download of the metrics may take a while.