Fig. 1
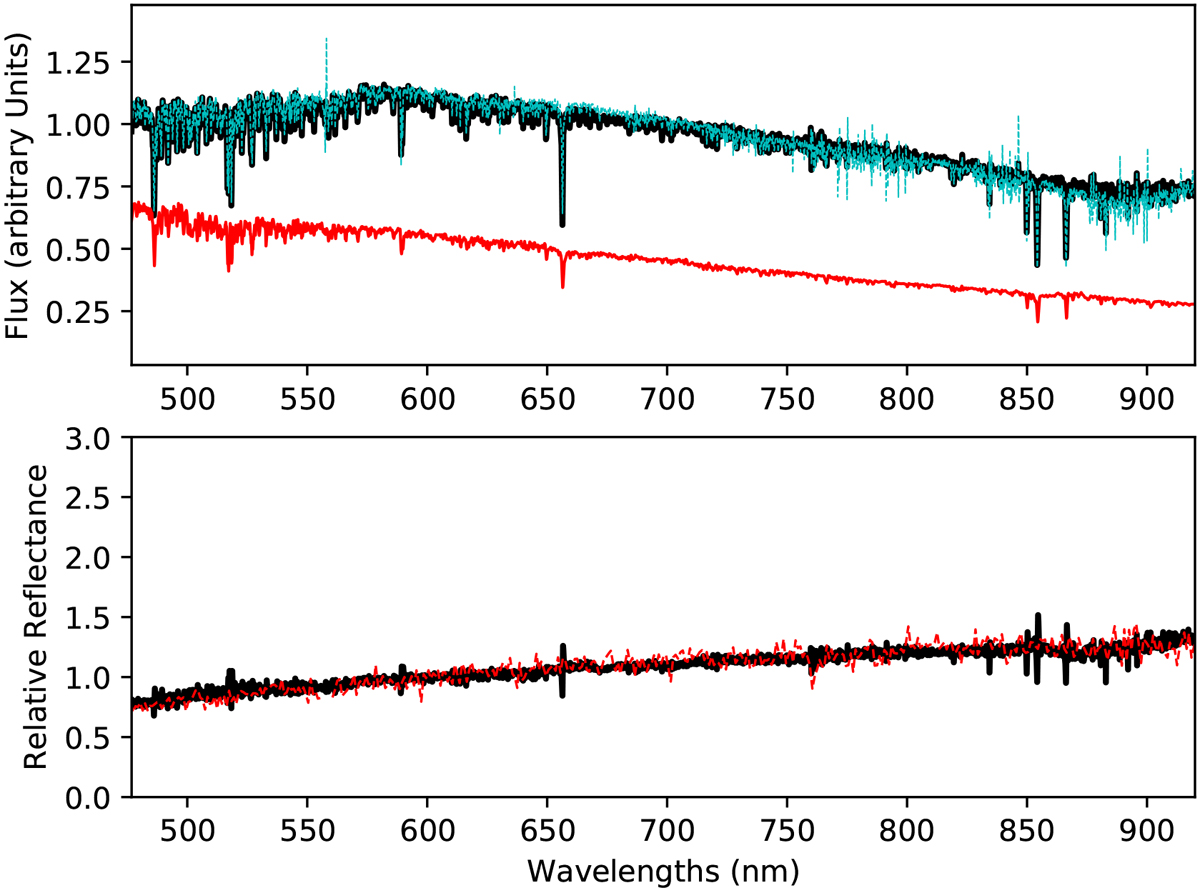
Top: spectrum of 67P dust coma (black) together with the solar spectrum used to compute the reflectance spectrum (red). The blue dotted line is the spectrum extracted over a 10′′ aperture. The solar spectrum has been shifted arbitrarily over the y-axis for better visibility. Bottom: relative reflectance spectrum of 67P (black), compared to the one measured with X-shooter in November 2014 (red; Snodgrass et al. 2016).
Current usage metrics show cumulative count of Article Views (full-text article views including HTML views, PDF and ePub downloads, according to the available data) and Abstracts Views on Vision4Press platform.
Data correspond to usage on the plateform after 2015. The current usage metrics is available 48-96 hours after online publication and is updated daily on week days.
Initial download of the metrics may take a while.