Fig. 8.
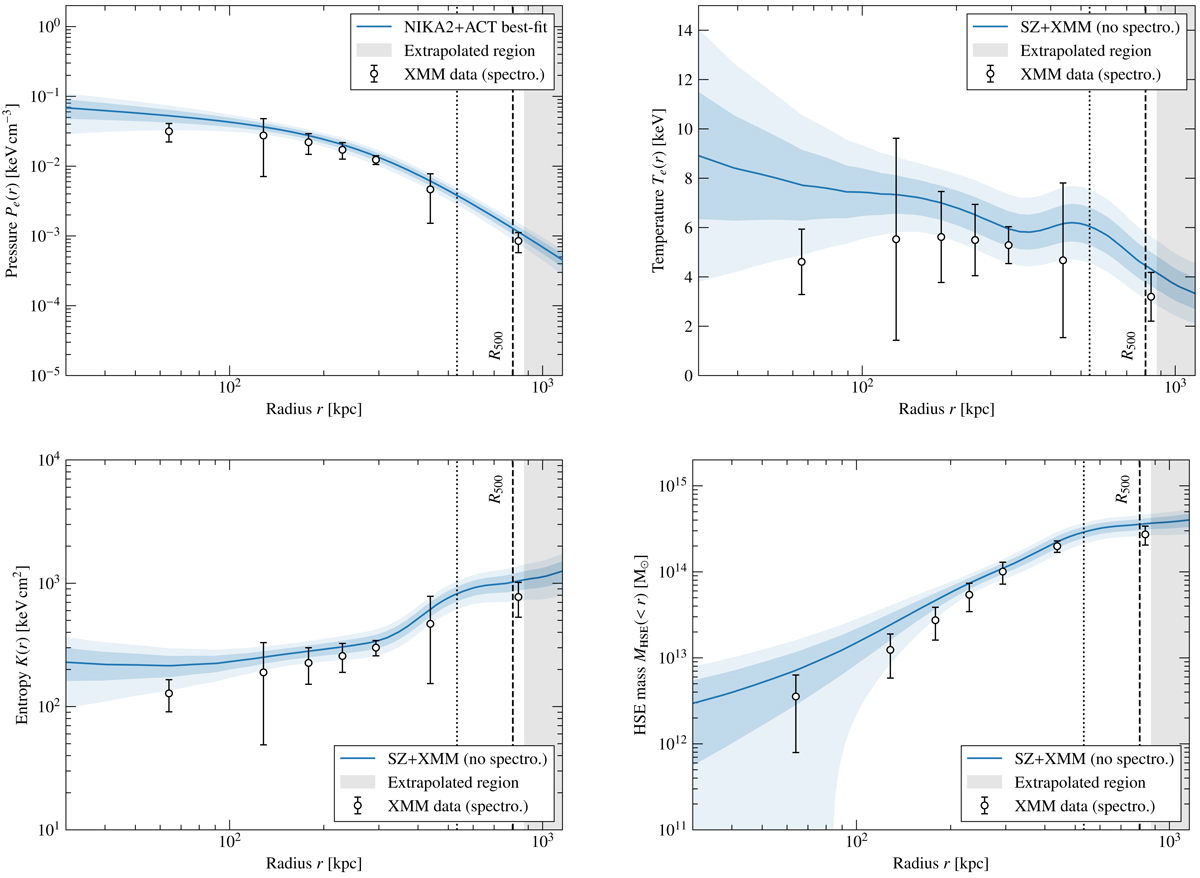
Radial profiles of the ICM pressure (top left), temperature (top right), entropy (bottom left), and hydrostatic mass (bottom right) of ACT-CL J0215.4+0030. For the pressure profile, the blue line shows the maximum likelihood profile from the NIKA2+ACT analysis. For the other profiles, it shows the profile obtained by combining the maximum likelihood pressure profile from NIKA2+ACT with the density from XMM-Newton. The blue envelopes show the 1σ and 2σ confidence intervals on these profiles. The white data points show the profiles obtained by combining XMM-Newton data with and without spectroscopy with 1σ errors. The dotted black line shows the limit of the region in which the S/N on the NIKA2 surface brightness profile is greater than 3. The shaded gray area shows the region in which the profiles are unconstrained by SZ data, i.e., beyond the measurement of ![]() .
.
Current usage metrics show cumulative count of Article Views (full-text article views including HTML views, PDF and ePub downloads, according to the available data) and Abstracts Views on Vision4Press platform.
Data correspond to usage on the plateform after 2015. The current usage metrics is available 48-96 hours after online publication and is updated daily on week days.
Initial download of the metrics may take a while.