Fig. 7.
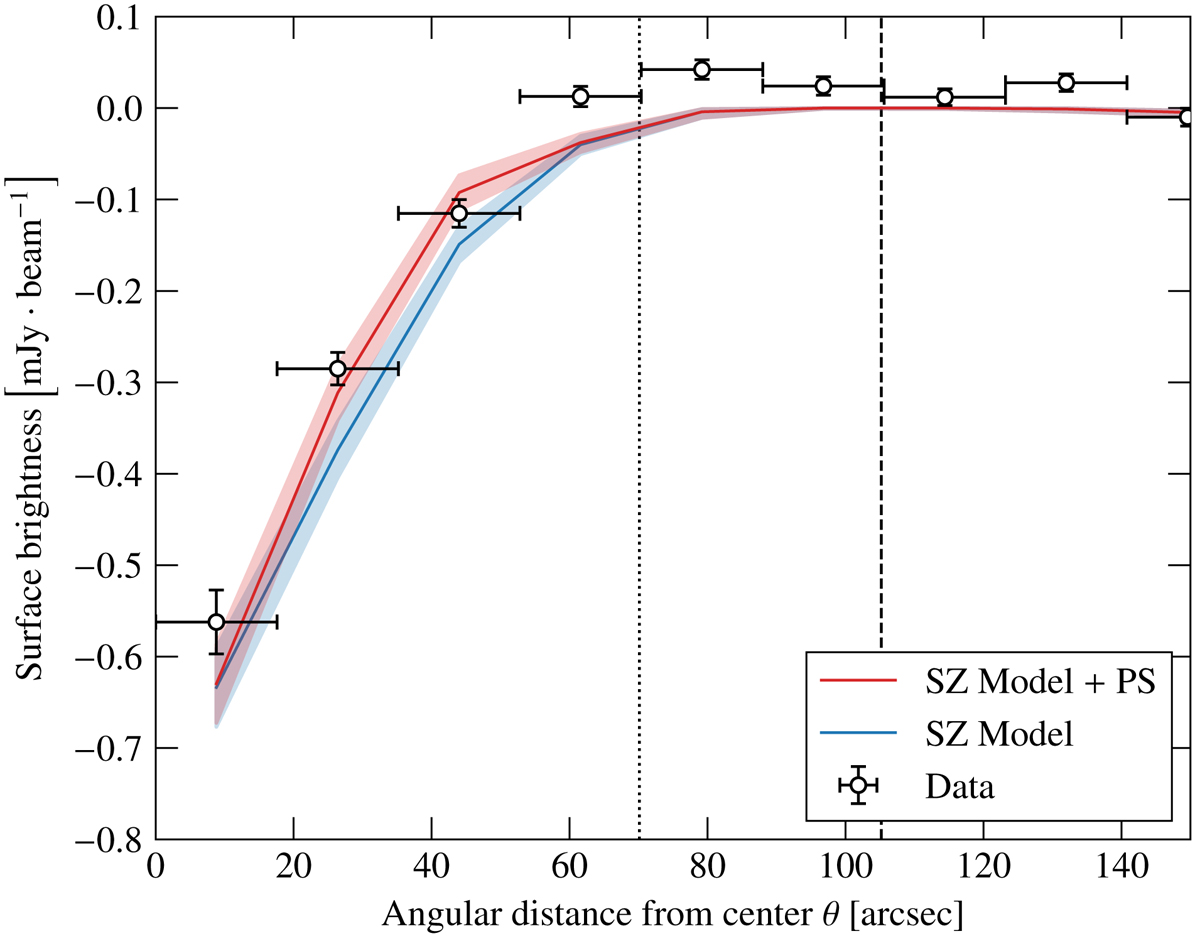
Projected radial profiles evaluated in concentric annuli centered on the SZ peak, with widths equal to the NIKA2 instrumental FWHM at 150 GHz. The white points show the radial profile of the NIKA2 SZ signal with 1σ errors. The red curve corresponds to the radial profile of our full SZ + point sources model, and the blue curve is the profile of the SZ signal alone. In each case, the envelopes are 1σ and show the dispersion in the posterior distribution sampled by our MCMC. The dotted vertical line shows the limit of the region in which the S/N on the surface brightness profile is 3σ. The dashed black line shows the angle subtended by R500, as reported in Table 2. We emphasize that this is only a comparison between the angular radial profile and the best fit on the 2D map, and that the fit is indeed performed in 2D; see Sect. 5.2.
Current usage metrics show cumulative count of Article Views (full-text article views including HTML views, PDF and ePub downloads, according to the available data) and Abstracts Views on Vision4Press platform.
Data correspond to usage on the plateform after 2015. The current usage metrics is available 48-96 hours after online publication and is updated daily on week days.
Initial download of the metrics may take a while.