Fig. 6.
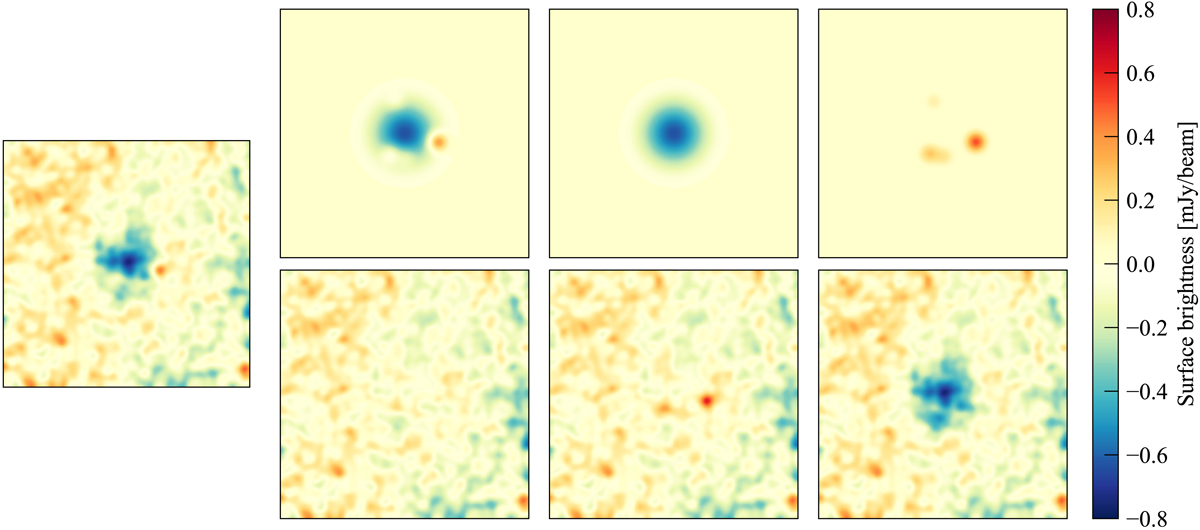
Results of the fit of the NIKA2 SZ map of ACT-CL J0215.4+0030. The far left panel is the NIKA2 150 GHz map. The best-fitting model and residuals are represented in the top and bottom panels of the center left column, respectively. The center right and far right columns show the best-fit model and residuals considering only the SZ signal and only the point sources. The NIKA2 maps are given in the same 4.5′ × 4.5′ area with the same color scale and smoothed with a 10″ Gaussian kernel for display purposes. The two southern sources have been subtracted from the NIKA2 map (see Sect. 5.2).
Current usage metrics show cumulative count of Article Views (full-text article views including HTML views, PDF and ePub downloads, according to the available data) and Abstracts Views on Vision4Press platform.
Data correspond to usage on the plateform after 2015. The current usage metrics is available 48-96 hours after online publication and is updated daily on week days.
Initial download of the metrics may take a while.