Open Access
Fig. 5.
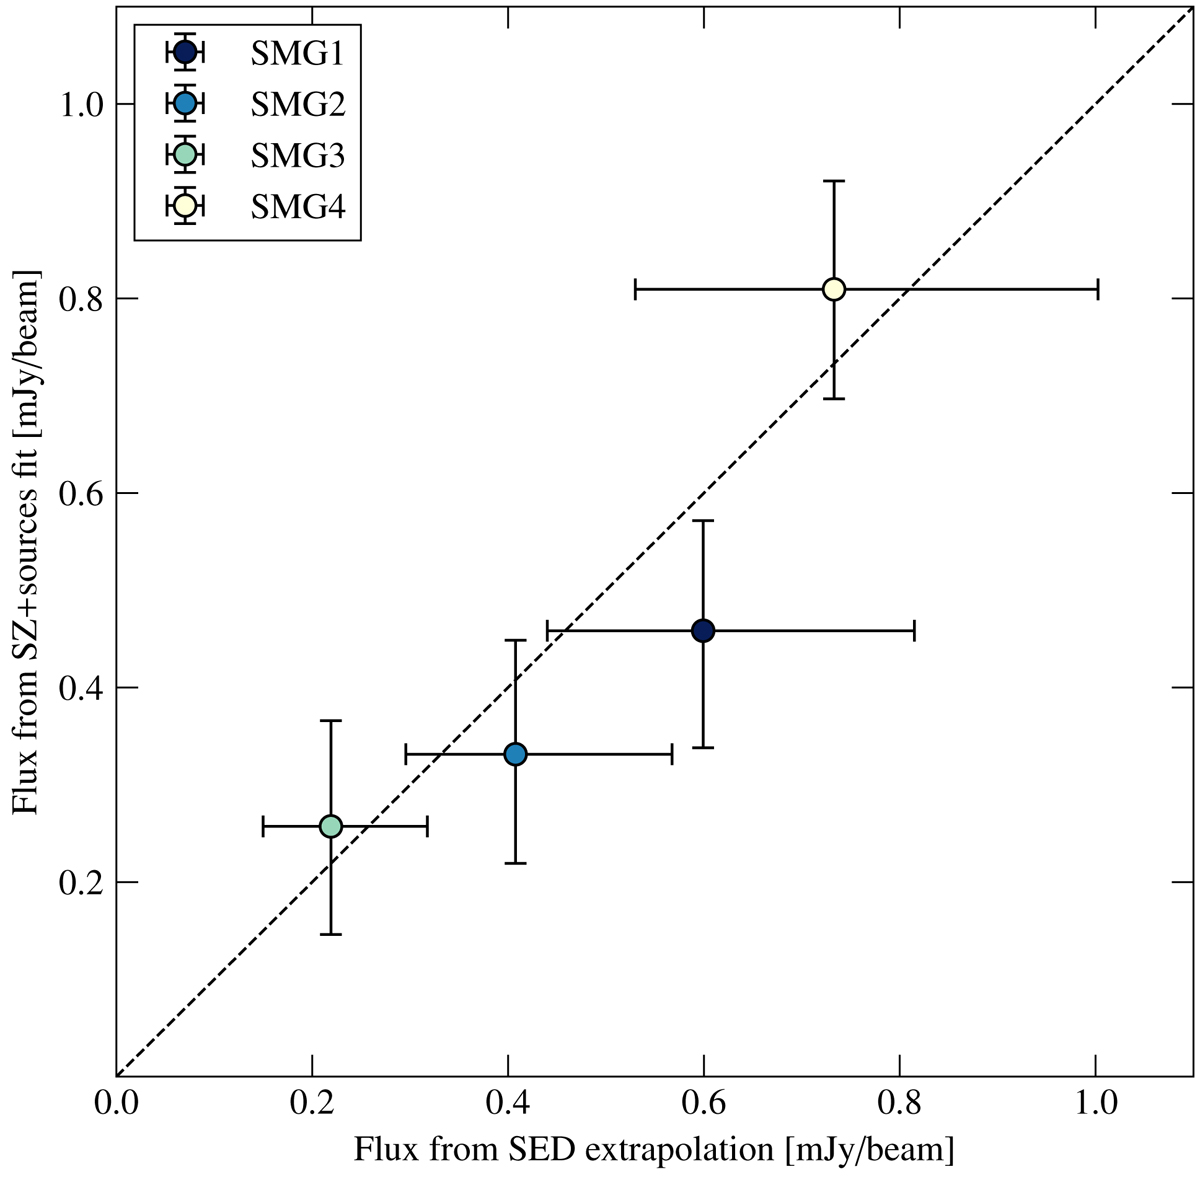
Comparison of the fluxes of point sources estimated by SED extrapolation (x-axis) and by point sources + ICM reconstruction analysis (y-axis). The error bar edges represent the 16th ant 84th percentile of the distributions. The two flux estimators are compatible within the error bars for each point source.
Current usage metrics show cumulative count of Article Views (full-text article views including HTML views, PDF and ePub downloads, according to the available data) and Abstracts Views on Vision4Press platform.
Data correspond to usage on the plateform after 2015. The current usage metrics is available 48-96 hours after online publication and is updated daily on week days.
Initial download of the metrics may take a while.