Fig. 4.
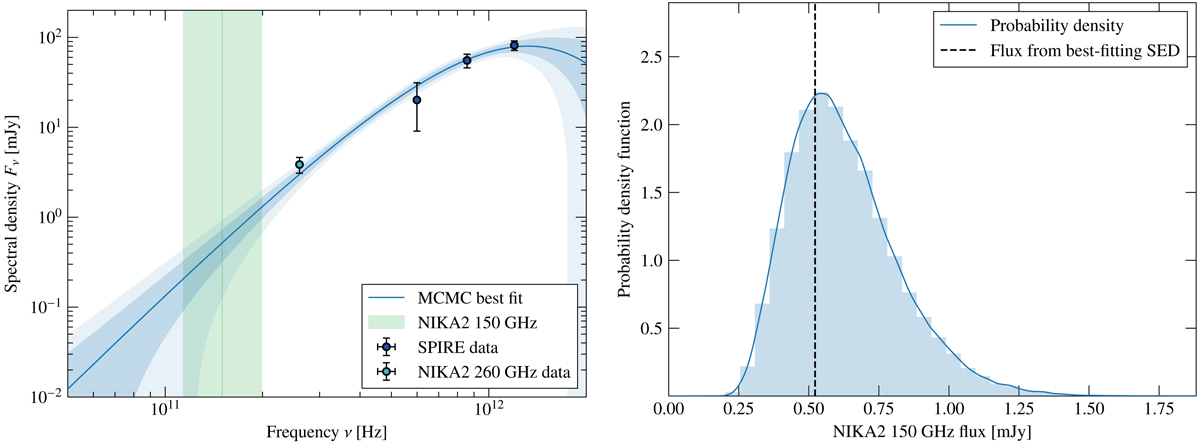
Left: spectral energy distribution of SMG1. The dark blue points mark the SPIRE fluxes as referenced in the HerS catalog (Viero et al. 2014). The light blue point shows the NIKA2 260 GHz flux measurement described in Sect. 4.2. The solid blue line represents the SED that best fits these four fluxes, and the blue envelopes mark the 1σ and 2σ confidence intervals. The shaded green region shows the NIKA2 150 GHz bandpass. Right: probability distribution for the flux of SMG1 in the NIKA2 150 GHz map. An SED is computed for each set of parameters sampled by our MCMC and integrated in the 150 GHz bandpass to obtain a flux value at this frequency. The histogram in pale blue shows the distribution of the set of computed fluxes. Kernel density estimation is applied on the whole set of fluxes to estimate the probability distribution for the source flux in the NIKA2 150 GHz map, shown as a solid blue line. The flux obtained from the maximum likelihood SED is shown as a dashed black line.
Current usage metrics show cumulative count of Article Views (full-text article views including HTML views, PDF and ePub downloads, according to the available data) and Abstracts Views on Vision4Press platform.
Data correspond to usage on the plateform after 2015. The current usage metrics is available 48-96 hours after online publication and is updated daily on week days.
Initial download of the metrics may take a while.