Fig. 3.
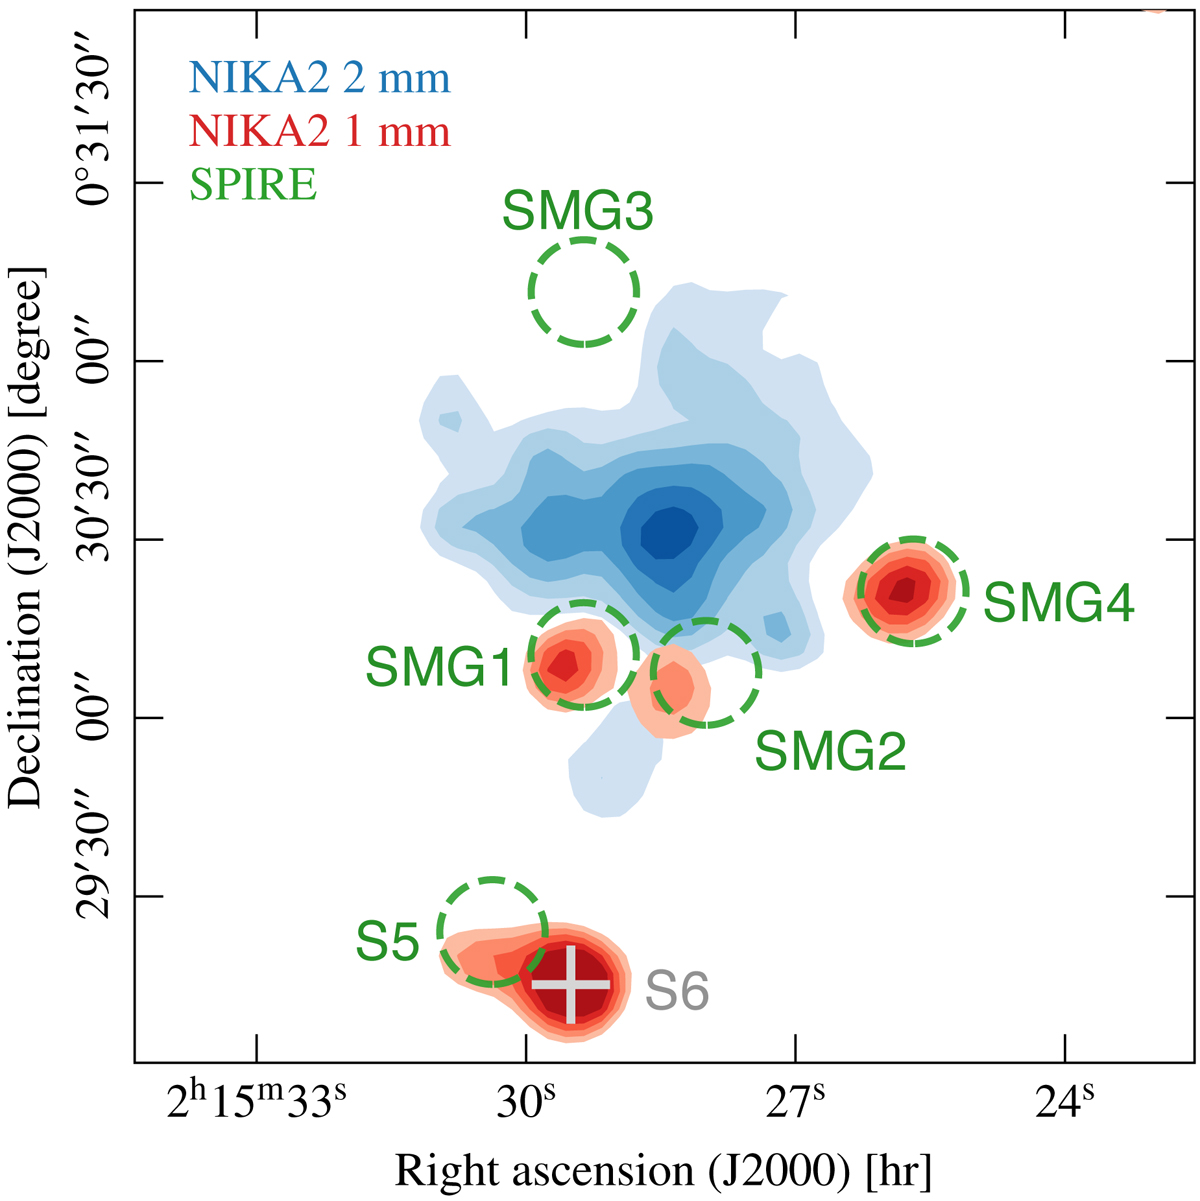
Composite multiwavelength map of the cluster region. The shaded blue regions show the NIKA2 150 GHz S/N contours, starting from 3σ with increments of 1σ. The shaded red areas represent regions with an S/N greater than 3 in the NIKA2 260 GHz map, i.e., the point sources. The green circles are centered at the Herschel positions of the five submillimetric point sources in our field, and their diameter is the FWHM of the SPIRE instrumental beam at 250 μm, i.e., 17.9″. The gray gross marks the position of S6, the source identified in NIKA2 that has no counterpart in the HerS catalog (see text for details).
Current usage metrics show cumulative count of Article Views (full-text article views including HTML views, PDF and ePub downloads, according to the available data) and Abstracts Views on Vision4Press platform.
Data correspond to usage on the plateform after 2015. The current usage metrics is available 48-96 hours after online publication and is updated daily on week days.
Initial download of the metrics may take a while.