Fig. 2.
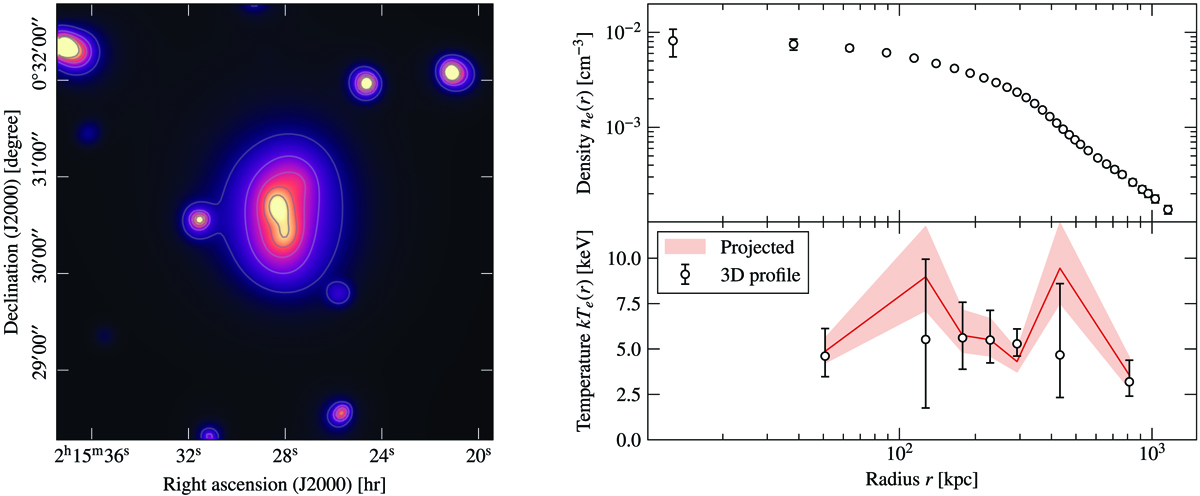
Left: wavelet-smoothed XMM-Newton photon-count image of the cluster. The region is the same as for the NIKA2 maps in Fig. 1. The isocontours are shown in grey. Right: electron density (top) and temperature (bottom) profiles extracted from XMM observations of the cluster. The profiles are extracted at the SZ surface brightness peak; see Sect. 3.2. Error bars are 1σ. For the temperature profile, the red line shows the projected temperature, and the white points represent the reconstructed 3D profile; see Pratt et al. (2010) for a detailed explanation of the difference.
Current usage metrics show cumulative count of Article Views (full-text article views including HTML views, PDF and ePub downloads, according to the available data) and Abstracts Views on Vision4Press platform.
Data correspond to usage on the plateform after 2015. The current usage metrics is available 48-96 hours after online publication and is updated daily on week days.
Initial download of the metrics may take a while.