Fig. A.1.
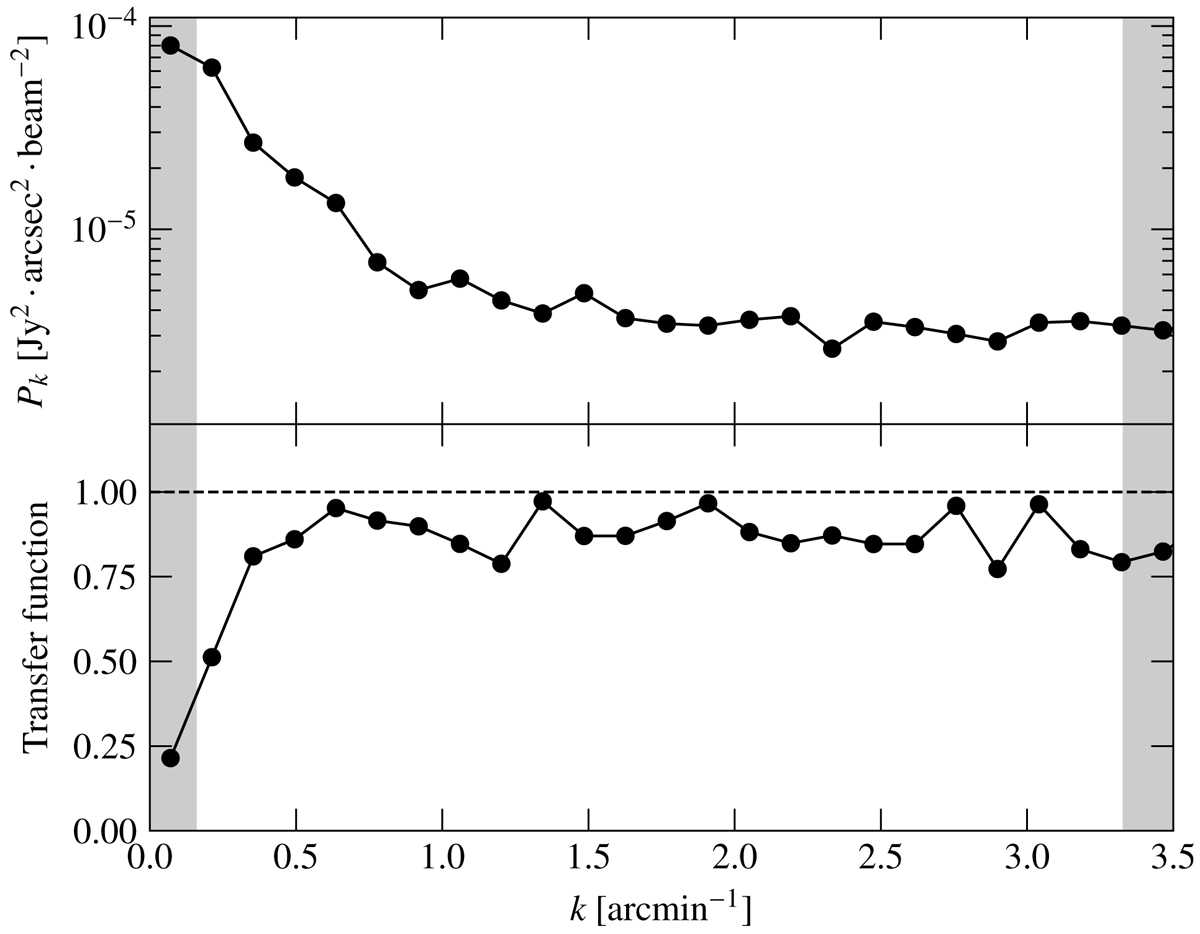
Null-map power spectrum (top) and transfer function (bottom) of our NIKA2 150 GHz data. The steepness of the power spectrum indicates large-scale correlated noise in our maps, which is accounted for in our analysis by computing a noise-covariance matrix. The transfer function, evaluated on simulations, quantifies the filtering our data went through. The angular scales are correctly recovered (with a transfer function above 80%) for k > 0.5 arcmin−1. For each panel, the shaded gray regions represent the NIKA2 field of view (left) and instrumental FWHM (right).
Current usage metrics show cumulative count of Article Views (full-text article views including HTML views, PDF and ePub downloads, according to the available data) and Abstracts Views on Vision4Press platform.
Data correspond to usage on the plateform after 2015. The current usage metrics is available 48-96 hours after online publication and is updated daily on week days.
Initial download of the metrics may take a while.