Fig. 1.
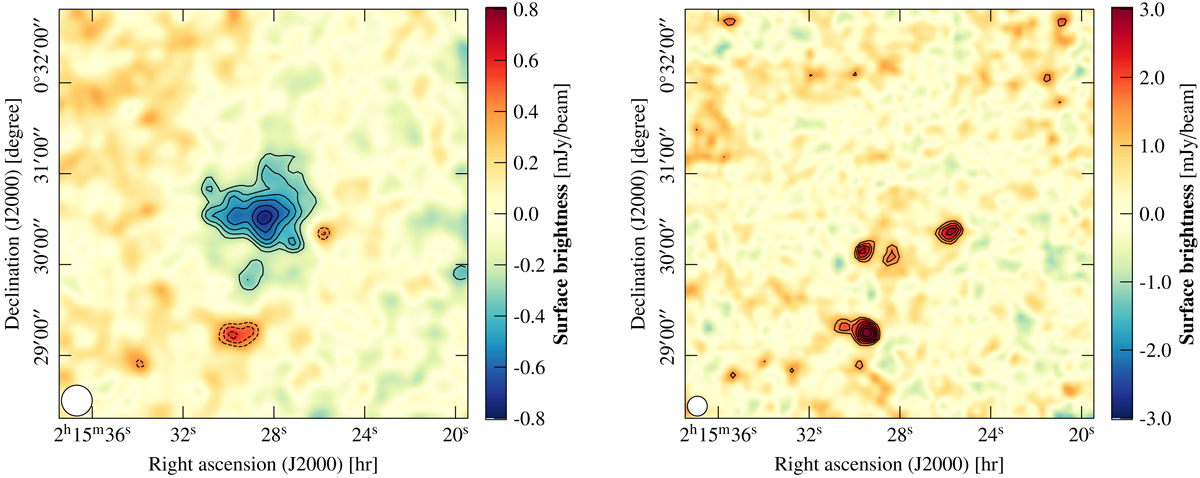
NIKA2 maps of the cluster in the 150 GHz (left) and 260 GHz (right) bands. Both maps are shown in a 4.5′ × 4.5′ square centered on the observed coordinates. In both maps, contours show S/N levels starting from ±3σ with a 1σ spacing. The left (right) map is smoothed with a 10″ (6″) Gaussian kernel for display purposes. The effective FWHM for each map is represented as a white disk in the bottom left corner.
Current usage metrics show cumulative count of Article Views (full-text article views including HTML views, PDF and ePub downloads, according to the available data) and Abstracts Views on Vision4Press platform.
Data correspond to usage on the plateform after 2015. The current usage metrics is available 48-96 hours after online publication and is updated daily on week days.
Initial download of the metrics may take a while.