Fig. 6
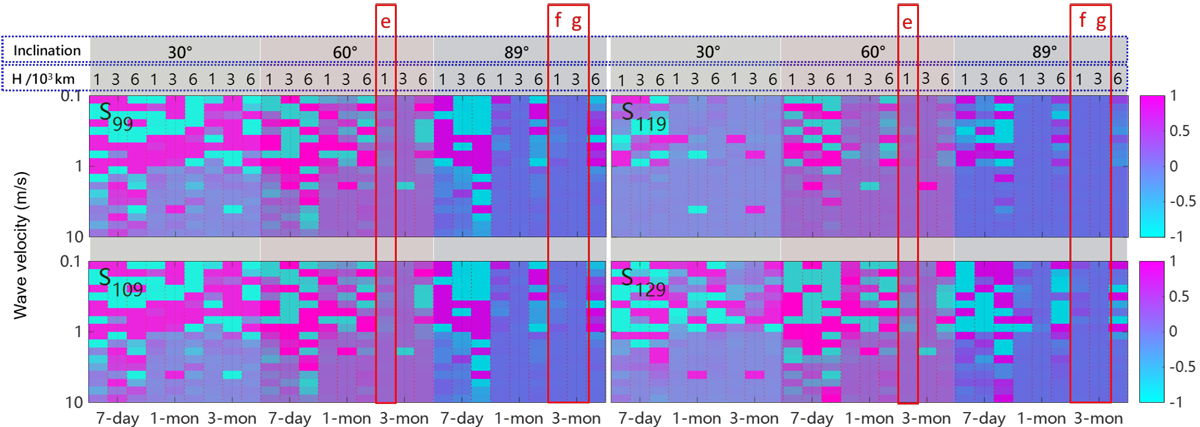
Difference rate of the targeted tesseral and sectoral coefficient solutions in the case of the
m0 = 9 weak-field dynamo. The targeted coefficients are ![]() ,
,
![]() ,
,
![]() , and
, and ![]() . The red lineboxes drawn on top of the chart figure, with legends e, f and g, denote the candidate mission schedules that successfully detect the weak-field dynamo. Explanations of the layout of this chart are the same as in the caption of Fig.
5.
. The red lineboxes drawn on top of the chart figure, with legends e, f and g, denote the candidate mission schedules that successfully detect the weak-field dynamo. Explanations of the layout of this chart are the same as in the caption of Fig.
5.
Current usage metrics show cumulative count of Article Views (full-text article views including HTML views, PDF and ePub downloads, according to the available data) and Abstracts Views on Vision4Press platform.
Data correspond to usage on the plateform after 2015. The current usage metrics is available 48-96 hours after online publication and is updated daily on week days.
Initial download of the metrics may take a while.