Fig. 5
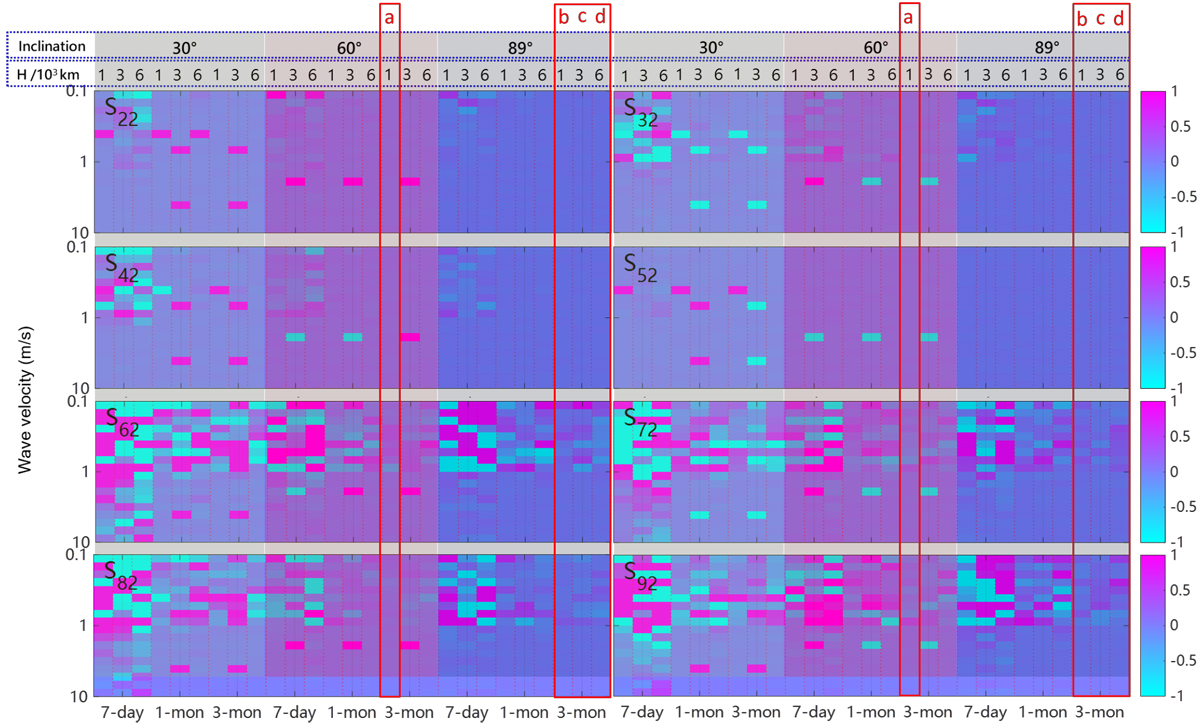
Difference rate of the targeted tesseral and sectoral coefficient solutions in the case of m0 = 2. The targeted coefficients are ![]() ,
,
![]() ,
,
![]() ,
,
![]() ,
,
![]() ,
,
![]() ,
,
![]() , and
, and ![]() . For each coefficient, the light green, light red, and light gray columns indicate three different inclination angles of
30°,
60°, and 89°. Each column has three subcolumns, arranged according to the orbit-tracking time of seven days, one month, and three months. Each subcolumn is further separated into another three subcolumns of 1, 3, and 6 km elevation of the orbit above the Saturn cloud-top surface. The row dimension labels different forward gravitational field models resulting from different convective flow speeds
. For each coefficient, the light green, light red, and light gray columns indicate three different inclination angles of
30°,
60°, and 89°. Each column has three subcolumns, arranged according to the orbit-tracking time of seven days, one month, and three months. Each subcolumn is further separated into another three subcolumns of 1, 3, and 6 km elevation of the orbit above the Saturn cloud-top surface. The row dimension labels different forward gravitational field models resulting from different convective flow speeds
![]() that are sampled into 19 cases of 0.1, 0.2, 0.3, 0.4, 0.5, 0.6, 0.7, 0.8, 0.9, 1, 2, 3, 4, 5, 6, 7, 8, 9, and 10 m s−1. The red lineboxes drawn on top of the chart figure, labeled a, b, c, and d, denote the candidate mission schedules that successfully detect the strong-field dynamo.
that are sampled into 19 cases of 0.1, 0.2, 0.3, 0.4, 0.5, 0.6, 0.7, 0.8, 0.9, 1, 2, 3, 4, 5, 6, 7, 8, 9, and 10 m s−1. The red lineboxes drawn on top of the chart figure, labeled a, b, c, and d, denote the candidate mission schedules that successfully detect the strong-field dynamo.
Current usage metrics show cumulative count of Article Views (full-text article views including HTML views, PDF and ePub downloads, according to the available data) and Abstracts Views on Vision4Press platform.
Data correspond to usage on the plateform after 2015. The current usage metrics is available 48-96 hours after online publication and is updated daily on week days.
Initial download of the metrics may take a while.