Fig. 7
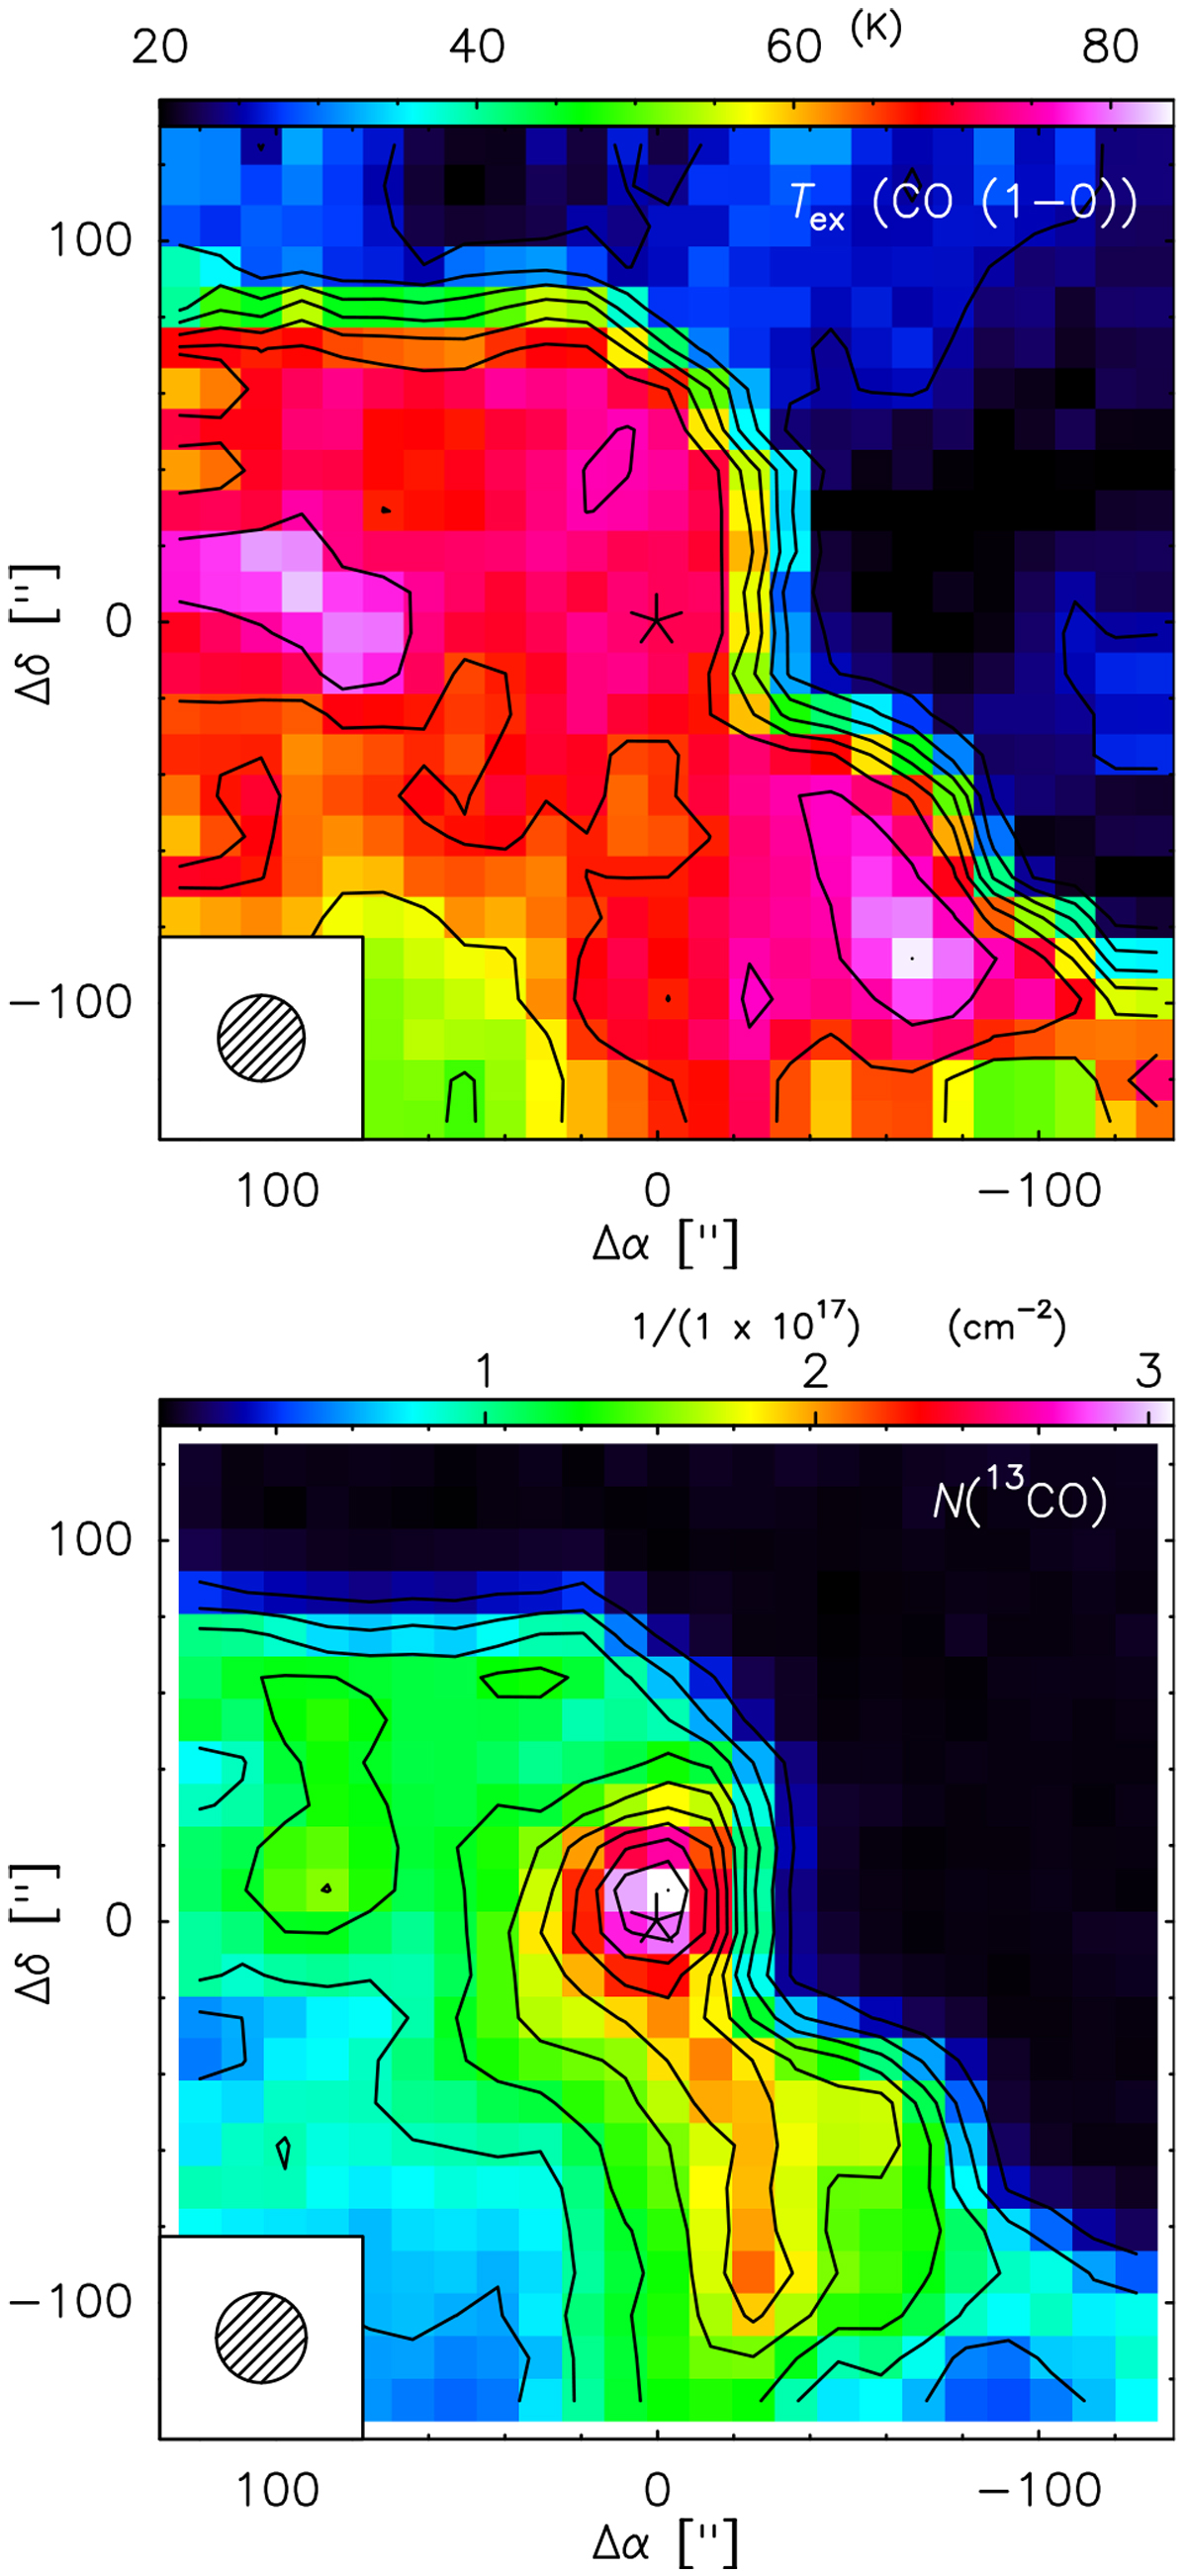
Upper panel: excitation temperature Tex determined for the J = 1 → 0 transition of 12CO and 13CO. Lower panel:total column density of 13CO,
![]() . Position offsets are relative to the position of M8E-IR (marked with an asterisk) given in Sect. 2. The contour levels are from 10 to 100% in steps of 10% peak emission (Table 1). The values of
Tmb and that of ∫
. Position offsets are relative to the position of M8E-IR (marked with an asterisk) given in Sect. 2. The contour levels are from 10 to 100% in steps of 10% peak emission (Table 1). The values of
Tmb and that of ∫ ![]() for the J
= 1 → 0 transition used to calculate Tex
and
for the J
= 1 → 0 transition used to calculate Tex
and ![]() were extracted from maps convolved to the same resolution of 24′′.
were extracted from maps convolved to the same resolution of 24′′.
Current usage metrics show cumulative count of Article Views (full-text article views including HTML views, PDF and ePub downloads, according to the available data) and Abstracts Views on Vision4Press platform.
Data correspond to usage on the plateform after 2015. The current usage metrics is available 48-96 hours after online publication and is updated daily on week days.
Initial download of the metrics may take a while.