Fig. 6
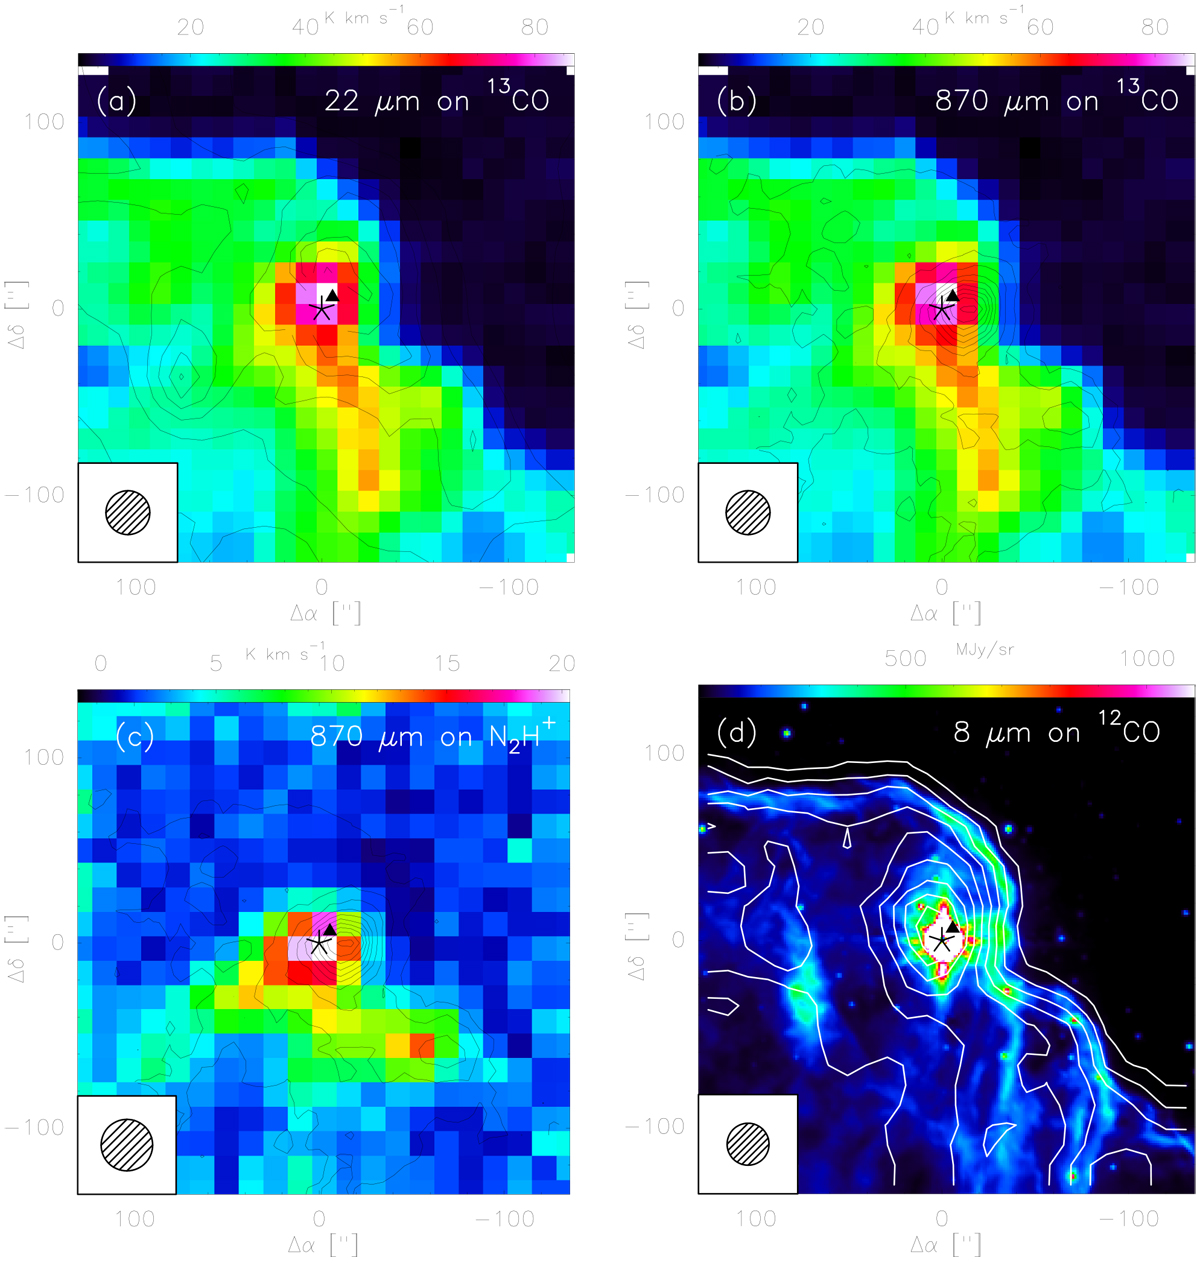
Top row: color map of the velocity-integrated intensity of J = 1 → 0 transition of 13CO overlaid with contours of panel a, WISE 22 μm mid-IR continuum emission and (b) ATLASGAL870 μm continuum emission toward M8 E. Bottom row, panel c: color map of the velocity-integrated intensity of J = 1 → 0 transition of N2H+ overlaid with ATLASGAL 870 μm dust continuum emission, and panel d: contours of the velocity-integrated intensity map of 12CO overlaid on the 8 μm PAH emission map. Position offsets are relative to the position of M8E-IR (marked with an asterisk) given in Sect. 2, and the ultracompact H II region, M8E-radio, at (α,δ)J2000 = 18h 04m52s8, −24°26′36′′ is represented by a black triangle. The 12CO and 13CO emission maps have their original resolutions of 22.5′′ and 23.5′′, respectively,the MIPSGAL 24 μm continuum emission has a resolution of 6′′, the ATLASGAL 870 μm continuum emission has a resolution of 18.2′′, and the GLIMPSE 8 μm continuum emission has a resolution of 0.6′′. The contour levels are 5 to 100% in steps of 10% for the MIPSGAL 24 μm (a) and the ATLASGAL 870 μm (b, c) overlays. For the GLIMPSE 8 μm (d) overlay, the contour levels are 10 to 100% in steps of 10%.
Current usage metrics show cumulative count of Article Views (full-text article views including HTML views, PDF and ePub downloads, according to the available data) and Abstracts Views on Vision4Press platform.
Data correspond to usage on the plateform after 2015. The current usage metrics is available 48-96 hours after online publication and is updated daily on week days.
Initial download of the metrics may take a while.