Fig. 3
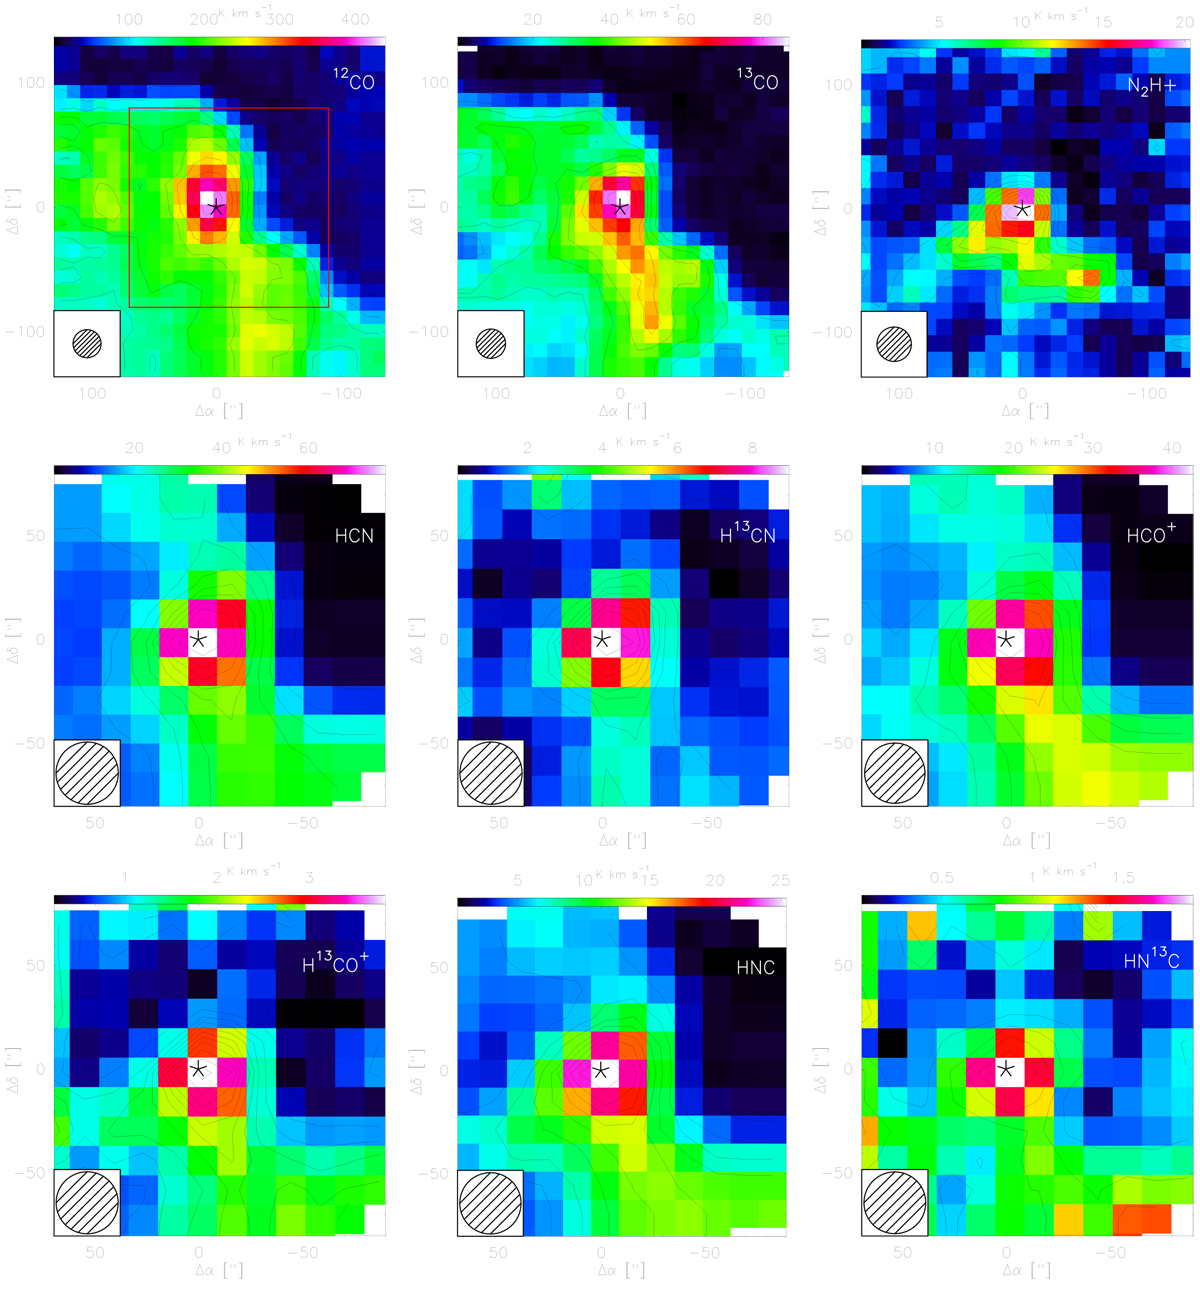
Color maps of the velocity-integrated intensity of the J = 1 → 0 transition of 12CO, 13CO, N2 H+, HCN, H13CN, HCO+, H13CO+, HNC and HN13C, toward M8 E. The square outlined by the dashed red lines in the map of 12CO denotes the area of the smaller maps of HCN, H13CN, HCO+, H13CO+, HNC, and HN13C. Position offsets are relative to the position of M8E-IR (marked with an asterisk) and given in Sect. 2. The contour levels are from 10 to 100% of the corresponding peak emission (given in Table 1) for 12CO, 13CO, N2 H+, HCN, H13CN, HCO+ and HNC. For H13CO+, and HN13C maps, the contour levels are from 3rms to peak emission in steps of 2rms. All maps are plotted using the original FWHM beam sizes shown in the lower left of each map and listed in Table 1.
Current usage metrics show cumulative count of Article Views (full-text article views including HTML views, PDF and ePub downloads, according to the available data) and Abstracts Views on Vision4Press platform.
Data correspond to usage on the plateform after 2015. The current usage metrics is available 48-96 hours after online publication and is updated daily on week days.
Initial download of the metrics may take a while.