Open Access
Fig. 10
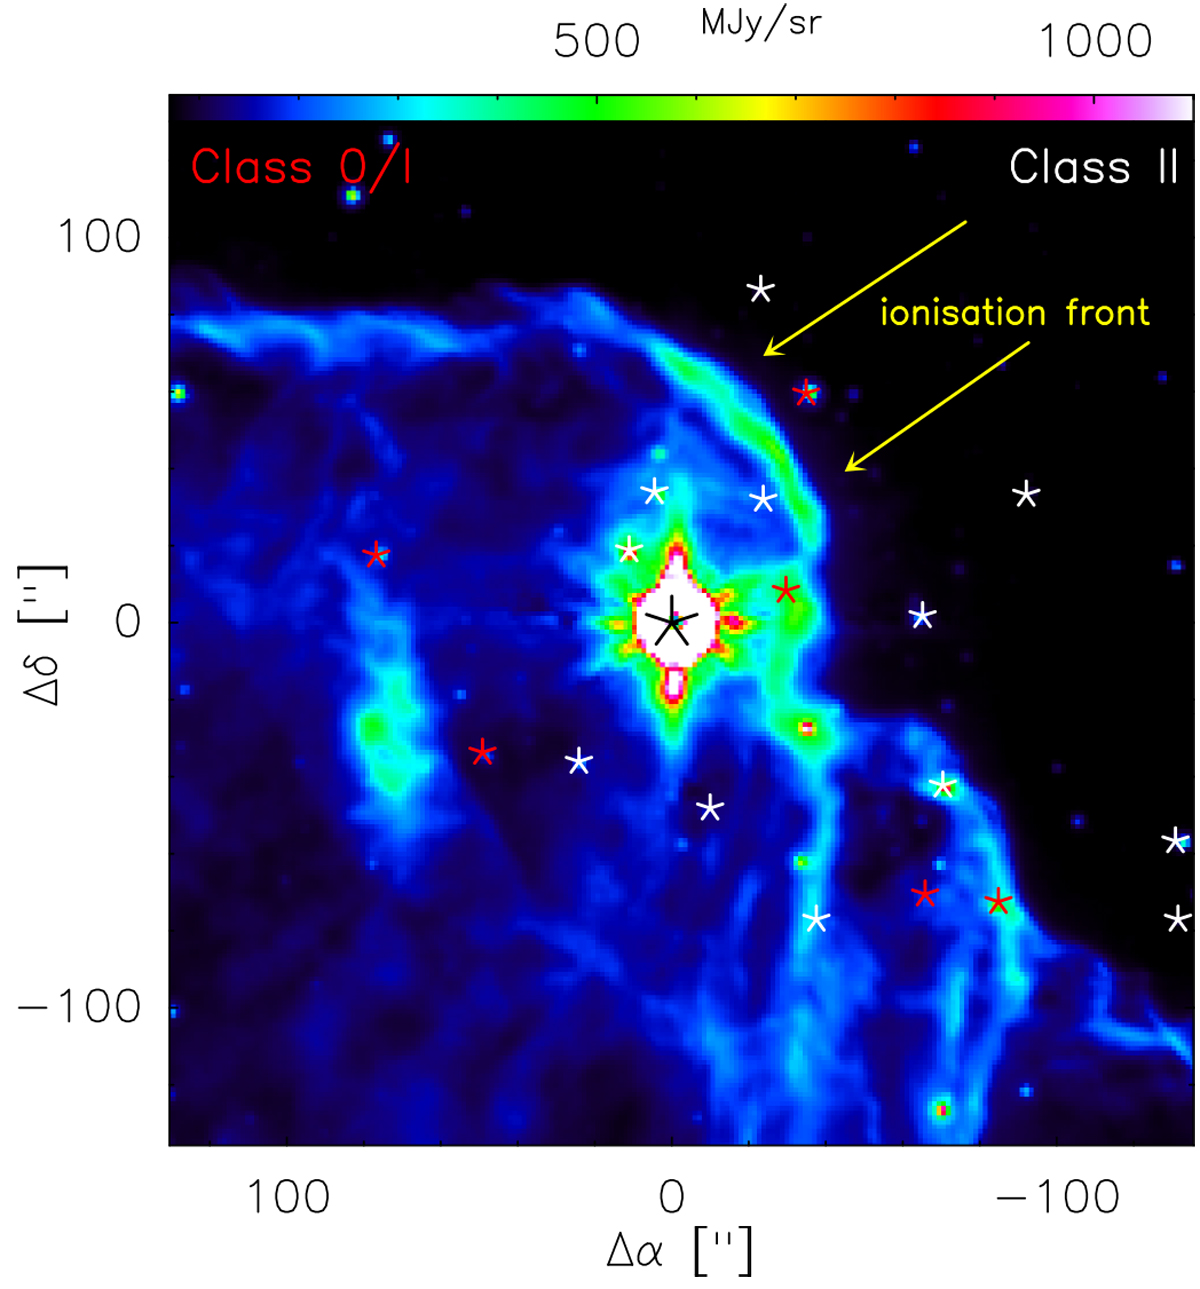
GLIMPSE 8 μm PAH emission distribution is shown in color scale along with the class 0/I (red) and class II (white) population of YSOs in M8 E. The IF, the bright rimmed structure, indicated by arrows (yellow). Position offsets are relative to the position of M8E-IR (marked with an asterisk) given in Sect. 2.
Current usage metrics show cumulative count of Article Views (full-text article views including HTML views, PDF and ePub downloads, according to the available data) and Abstracts Views on Vision4Press platform.
Data correspond to usage on the plateform after 2015. The current usage metrics is available 48-96 hours after online publication and is updated daily on week days.
Initial download of the metrics may take a while.