Fig. 5
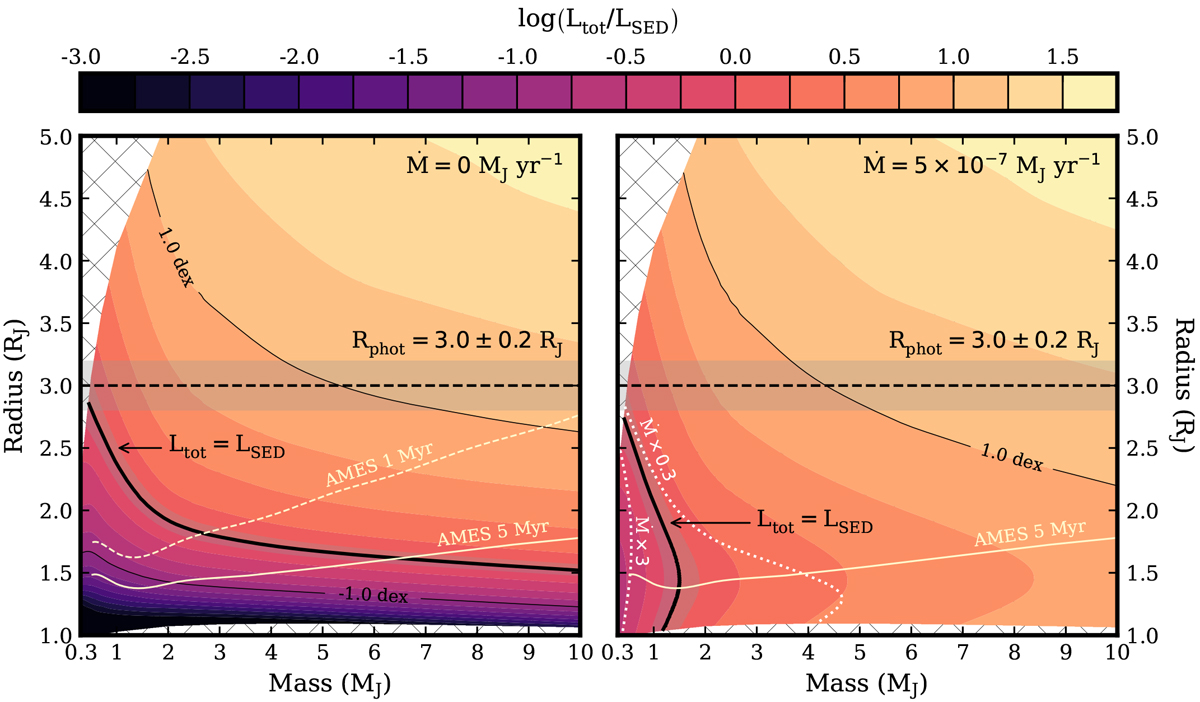
Total luminosity from standard models of isolated planets as a function of mass and radius, but withalso the accretion luminosity from the planet surface shock (Eq. (4) with LCPD = 0). The thick black contour and gray shade highlight the measured luminosity and 5σ uncertainty (see main text for details), log(LSED∕L⊙) = −3.79 ± 0.02, and the thin black contours are steps of 1.0 dex relative to LSED. The accretion rate was set to Ṁ = 0 in the left panel and Ṁ = 5 × 10⁻⁷ MJ yr−1 (Hashimoto et al. 2020) in the right panel. The inferred photospheric radius and 1σ uncertainty, Rphot ± σ, are shown with a horizontally dashed line and gray shaded area. The light yellow curves show as reference the mass–radius predictions by the AMES (Cond/Dusty) structure model at 5 Myr (solid) and 1 Myr (dashed). The dotted white lines in the right panel show Ltot = LSED with Ṁ scaled by a factor of 0.3 and 3. The crosshatched regions indicate parts of the parameter space for which no predictions are available from the structure model: because of electron degeneracy pressure at small radii, and because no stable hydrostatic structure exists at large radii.
Current usage metrics show cumulative count of Article Views (full-text article views including HTML views, PDF and ePub downloads, according to the available data) and Abstracts Views on Vision4Press platform.
Data correspond to usage on the plateform after 2015. The current usage metrics is available 48-96 hours after online publication and is updated daily on week days.
Initial download of the metrics may take a while.