Fig. 3
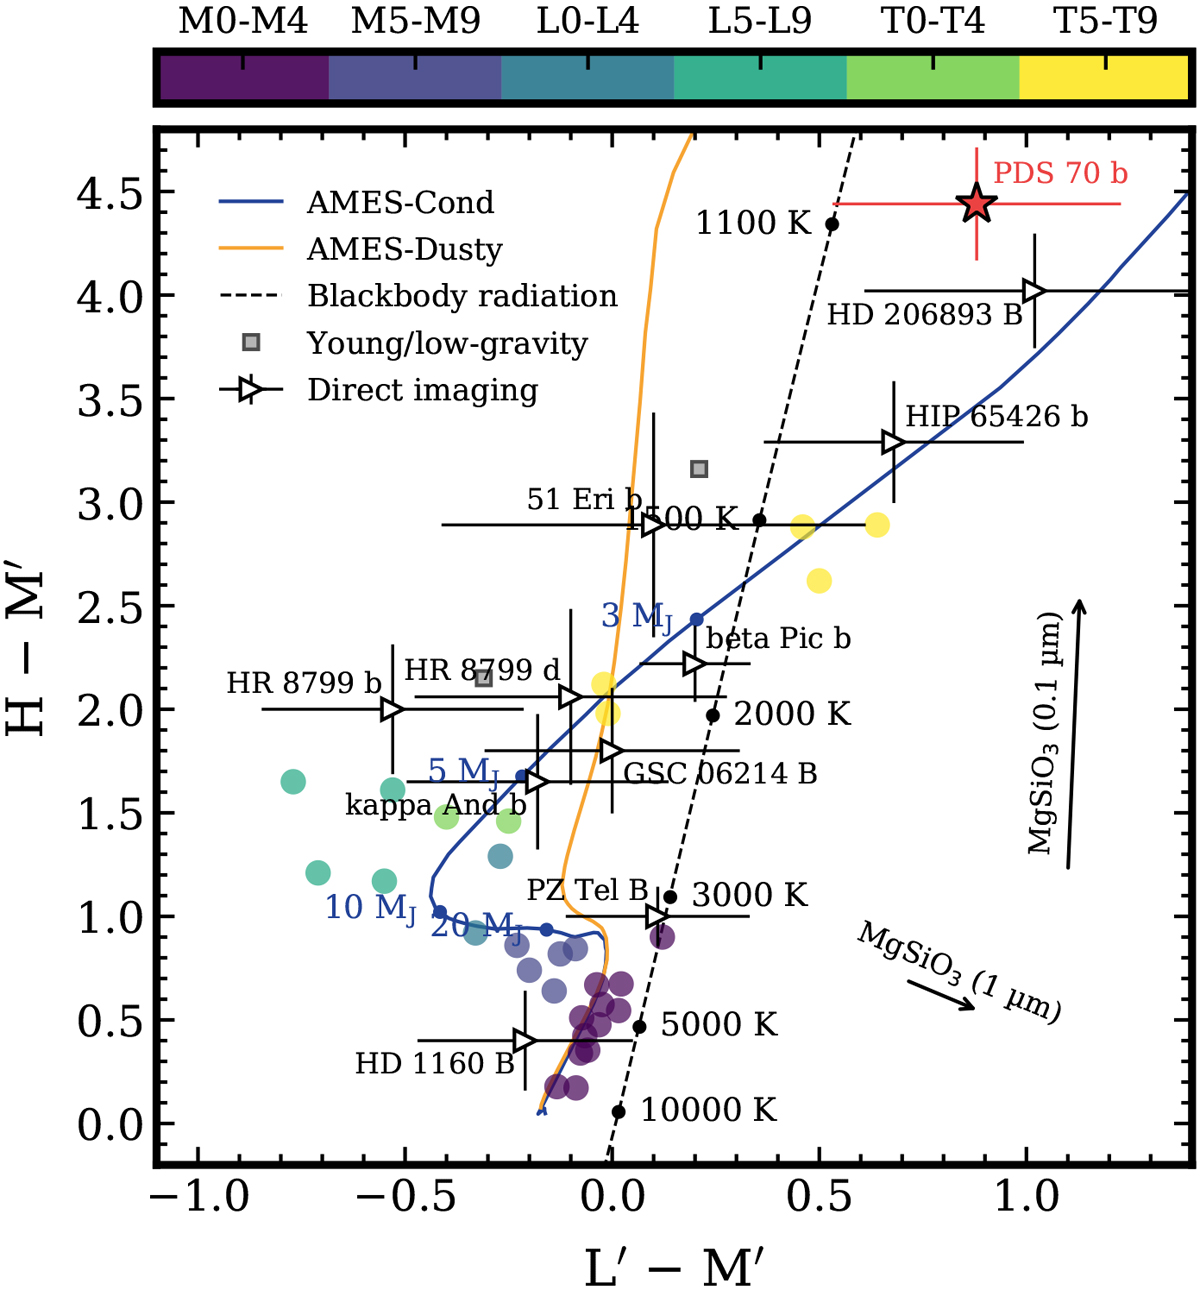
Color–color diagram of H–M′ versus L′–M′. The field objects are color-coded by M, L, and T spectral types (see discrete colorbar), the young and low-gravity dwarf objects are indicated with a gray square, and the directly imaged companions are labeled individually. PDS 70 b is highlighted with a red star. The blue and orange lines show the synthetic colors computed from the AMES-Cond and AMES-Dusty evolutionary tracks at an age of 5 Myr. The black dashed line shows the synthetic colors of a blackbody spectrum. The black arrows indicate the reddening by MgSiO3 grains with amean radius of 0.1 and 1 μm, and ![]() of 0.05 and 5 mag, respectively.
of 0.05 and 5 mag, respectively.
Current usage metrics show cumulative count of Article Views (full-text article views including HTML views, PDF and ePub downloads, according to the available data) and Abstracts Views on Vision4Press platform.
Data correspond to usage on the plateform after 2015. The current usage metrics is available 48-96 hours after online publication and is updated daily on week days.
Initial download of the metrics may take a while.