Fig. 4.
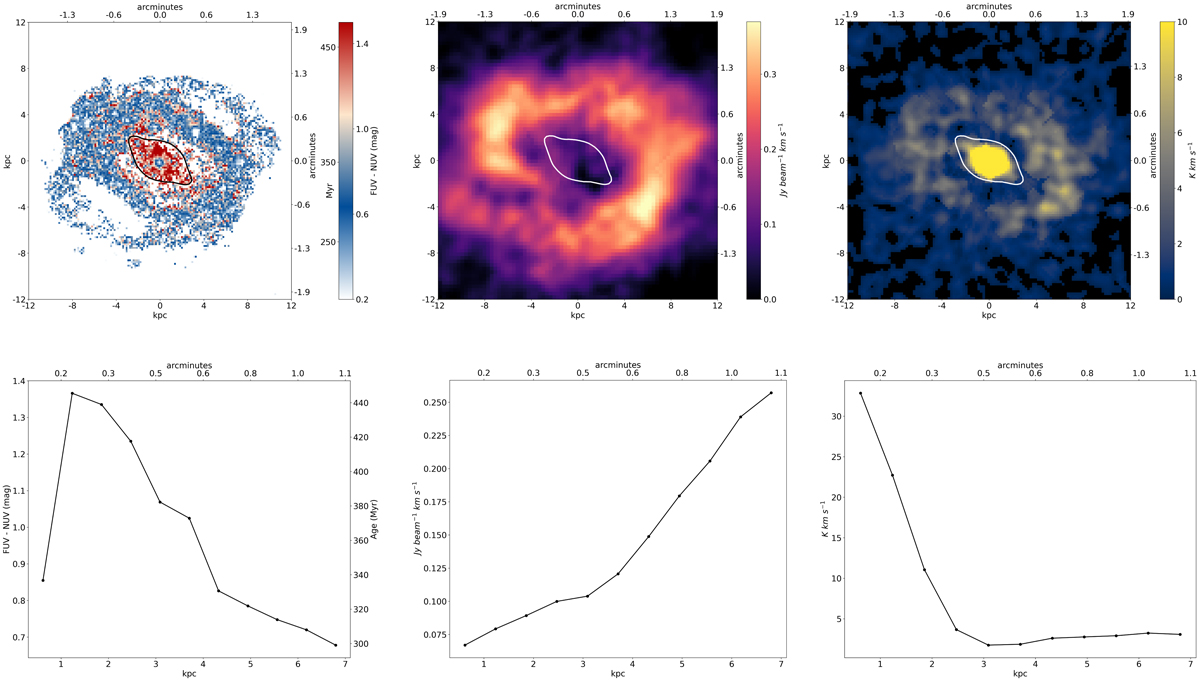
NGC 4579. First row: (1) FUV−NUV colour map. The black contour shows the stellar bar detected in the Spitzer IRAC 3.6 μ galaxy image. The pixels are colour-coded in units of FUV−NUV colour. The corresponding SSP equivalent ages are also noted in the colour bar. (2) The HI and CO galaxy maps are shown in the next two columns; the stellar bar is plotted in white. The corresponding azimuthally averaged profile of the galaxy is shown in the bottom row. The main bodies of the galaxies were averaged in elliptical annuli of width 0.1 arcmin (0.62 kpc) taking the ellipticity and position angle of the galaxy into account.
Current usage metrics show cumulative count of Article Views (full-text article views including HTML views, PDF and ePub downloads, according to the available data) and Abstracts Views on Vision4Press platform.
Data correspond to usage on the plateform after 2015. The current usage metrics is available 48-96 hours after online publication and is updated daily on week days.
Initial download of the metrics may take a while.