Fig. 6.
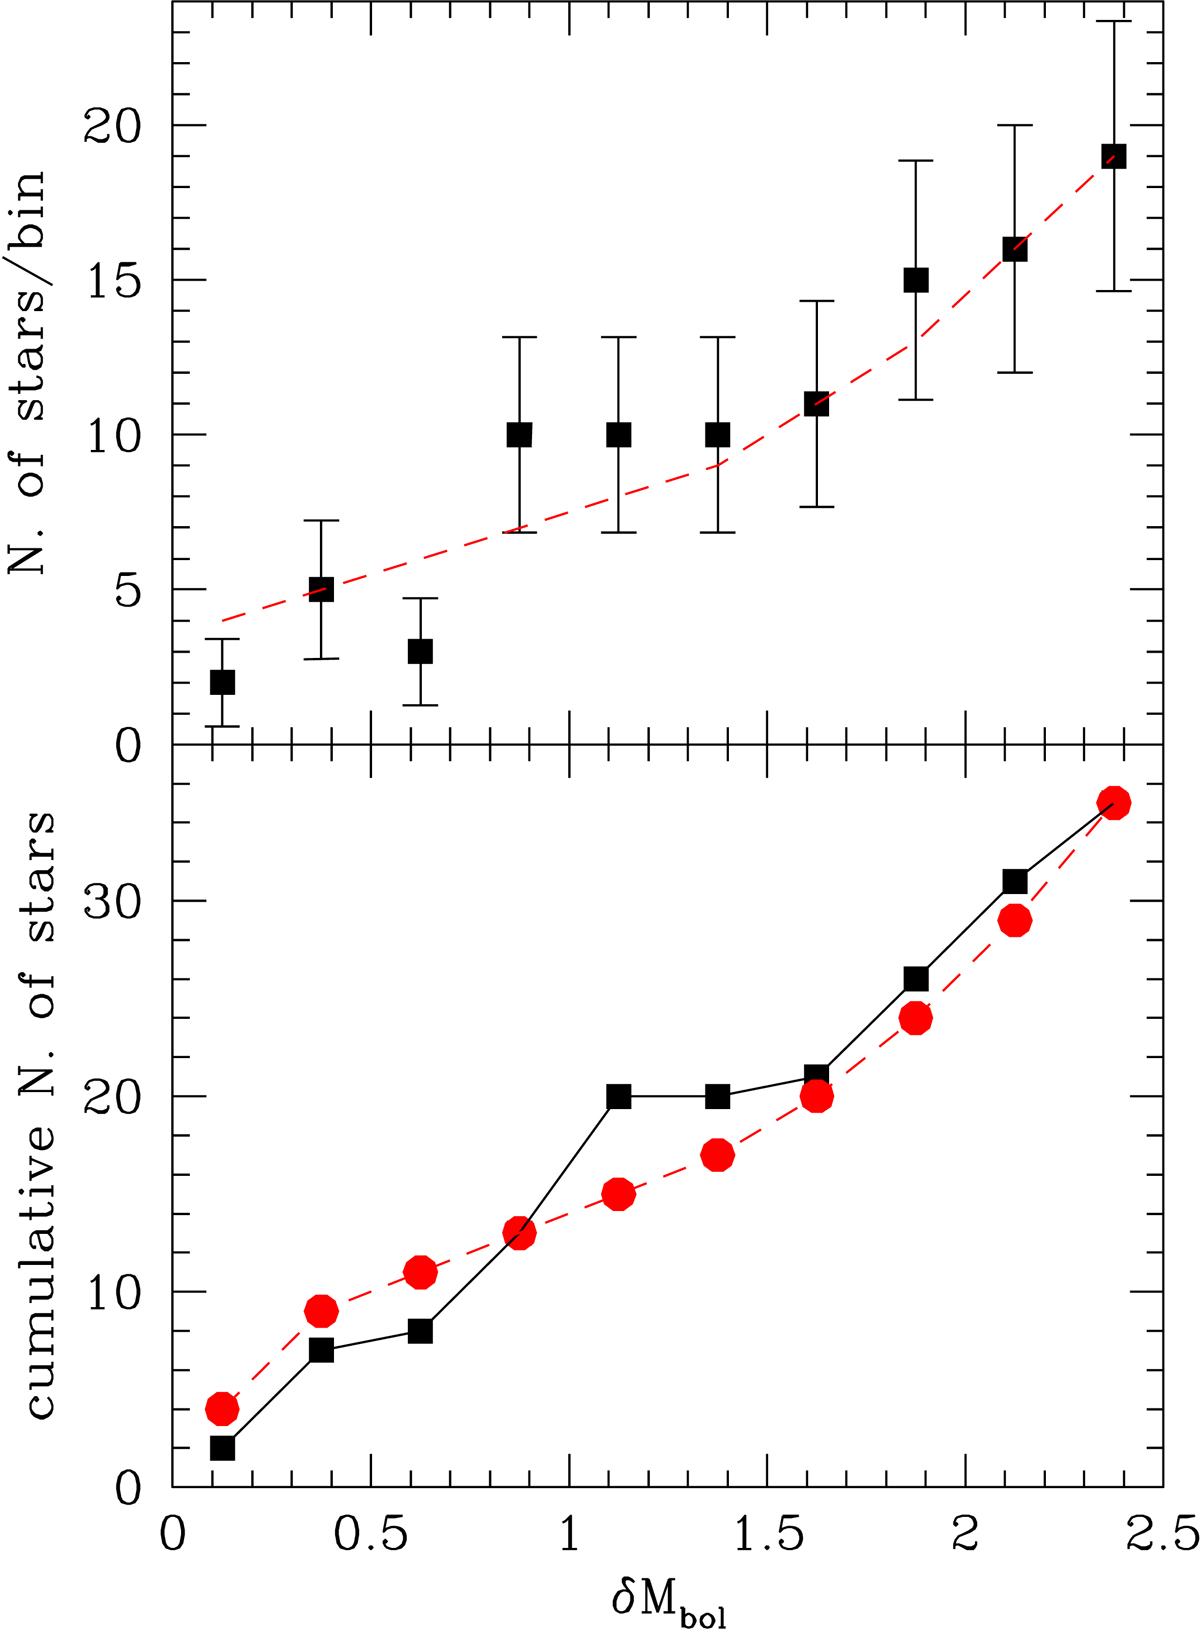
Upper panel: observed luminosity function of the 2.5 mag brightest portion of the RGB of cluster M5 (squares) is compared to the theoretical luminosity function (dashed line). Poisson errors (![]() ) are also shown. Lower panel: the cumulative LF of the brightest portion of the M5 RGB (solid line and squares) is compared to the theoretical expectation (dashed line and circles).
) are also shown. Lower panel: the cumulative LF of the brightest portion of the M5 RGB (solid line and squares) is compared to the theoretical expectation (dashed line and circles).
Current usage metrics show cumulative count of Article Views (full-text article views including HTML views, PDF and ePub downloads, according to the available data) and Abstracts Views on Vision4Press platform.
Data correspond to usage on the plateform after 2015. The current usage metrics is available 48-96 hours after online publication and is updated daily on week days.
Initial download of the metrics may take a while.