Free Access
Fig. 10.
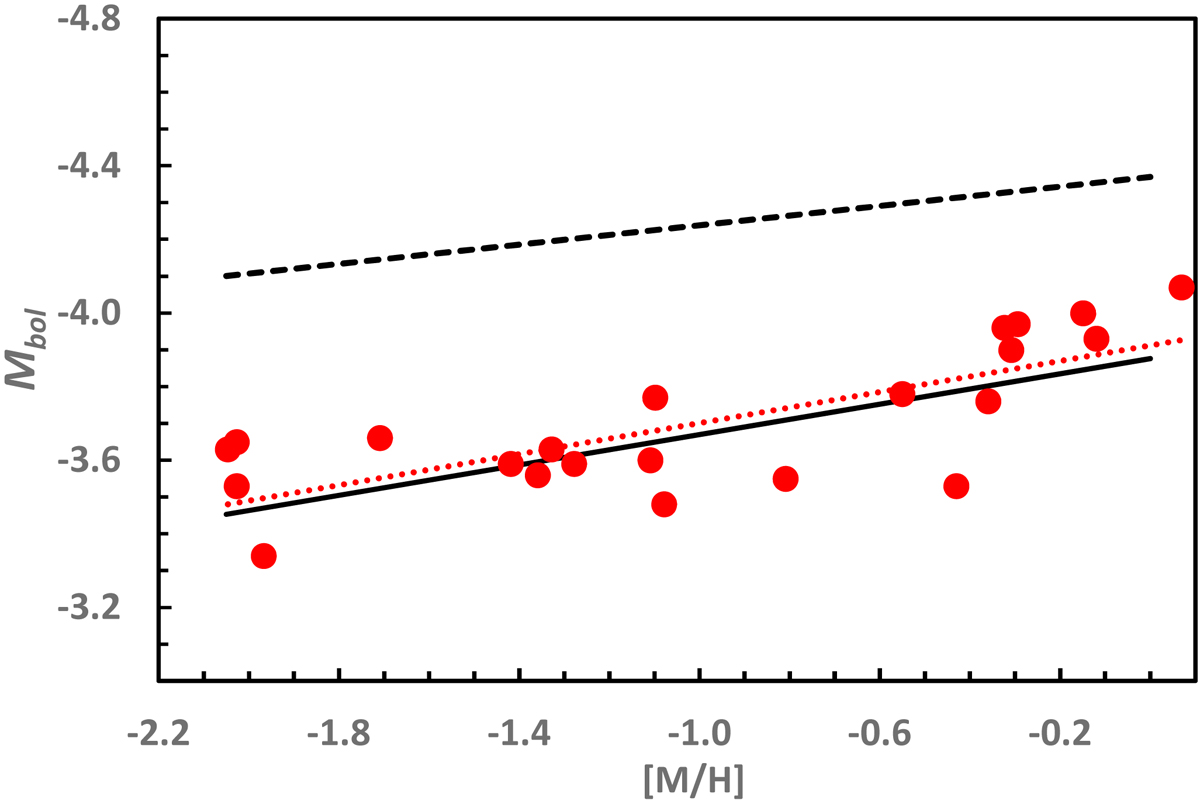
Tip bolometric magnitude derived from optical and IR photometry of 22 GGCs (red circles) are compared to our theoretical predictions for g13 = 0 (black solid line) and g13 = 4 (black dashed line). The red dotted line represents the least-squares fit of the 22 observed Mbol.
Current usage metrics show cumulative count of Article Views (full-text article views including HTML views, PDF and ePub downloads, according to the available data) and Abstracts Views on Vision4Press platform.
Data correspond to usage on the plateform after 2015. The current usage metrics is available 48-96 hours after online publication and is updated daily on week days.
Initial download of the metrics may take a while.