Fig. 7.
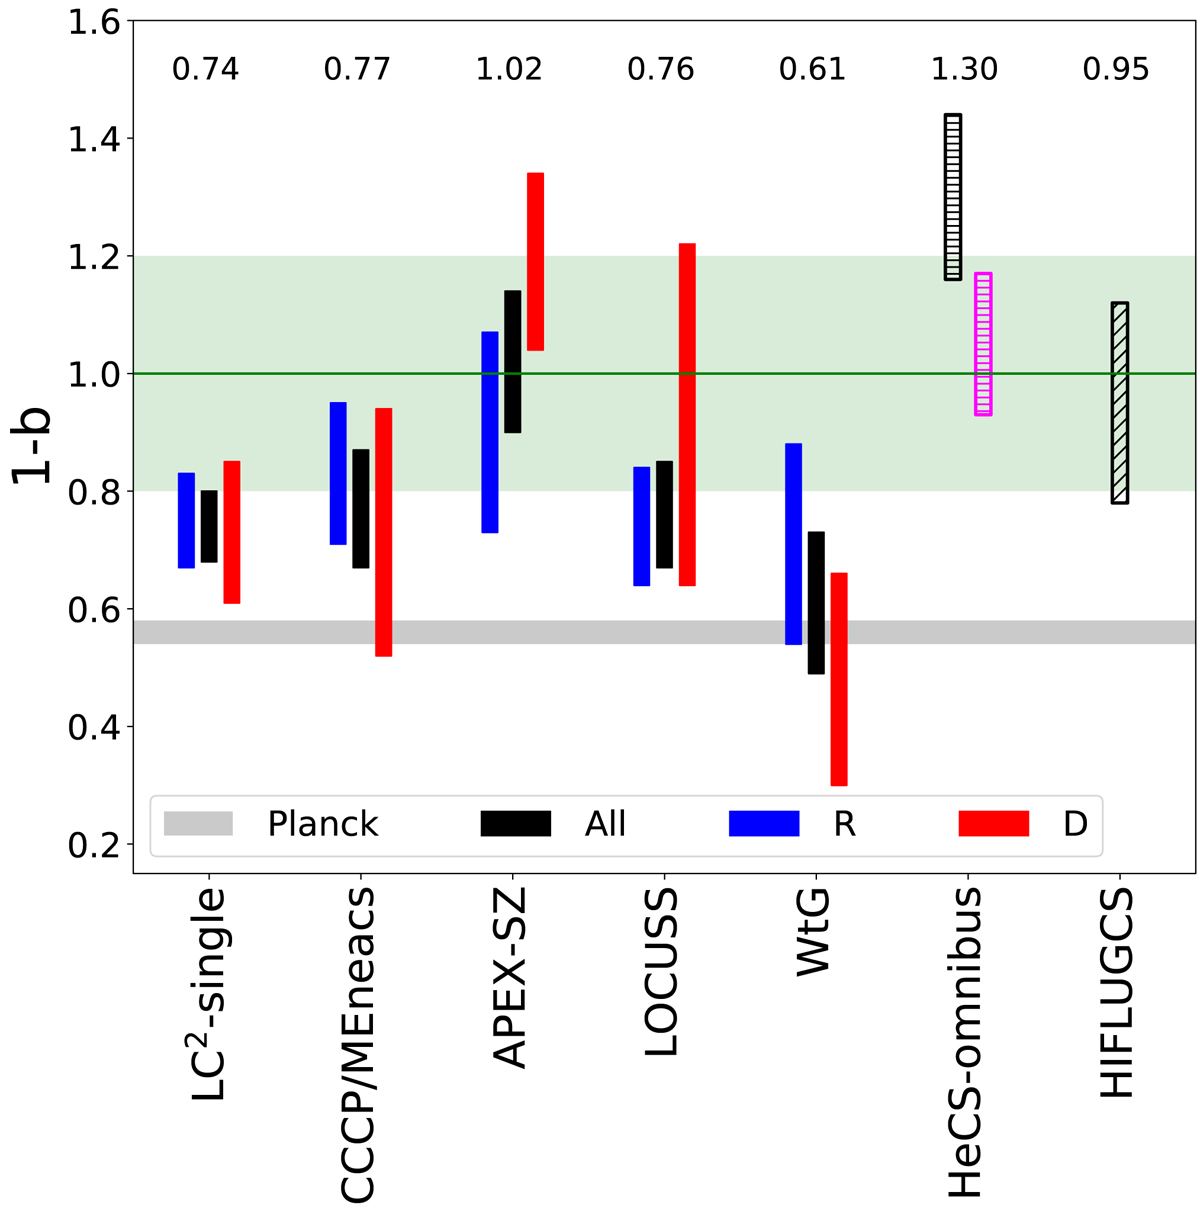
Hydrostatic mass bias for each of the subsamples investigated in this paper. Filled color bars represent the mass bias estimated using WL masses, while horizontal and diagonal hatches show the estimates using masses from caustics and velocity dispersion, respectively. In magenta we show the bias obtained with caustics after removing the clusters with few member galaxies. The bar lengths enclose the 1σ estimates and the central values are also reported on the top of the panel. The gray line represents the bias necessary to reconcile Planck number counts and CMB. The green shaded region indicates the area defined as ± 20% centered on 1-b = 0.
Current usage metrics show cumulative count of Article Views (full-text article views including HTML views, PDF and ePub downloads, according to the available data) and Abstracts Views on Vision4Press platform.
Data correspond to usage on the plateform after 2015. The current usage metrics is available 48-96 hours after online publication and is updated daily on week days.
Initial download of the metrics may take a while.