Free Access
Fig. 6.
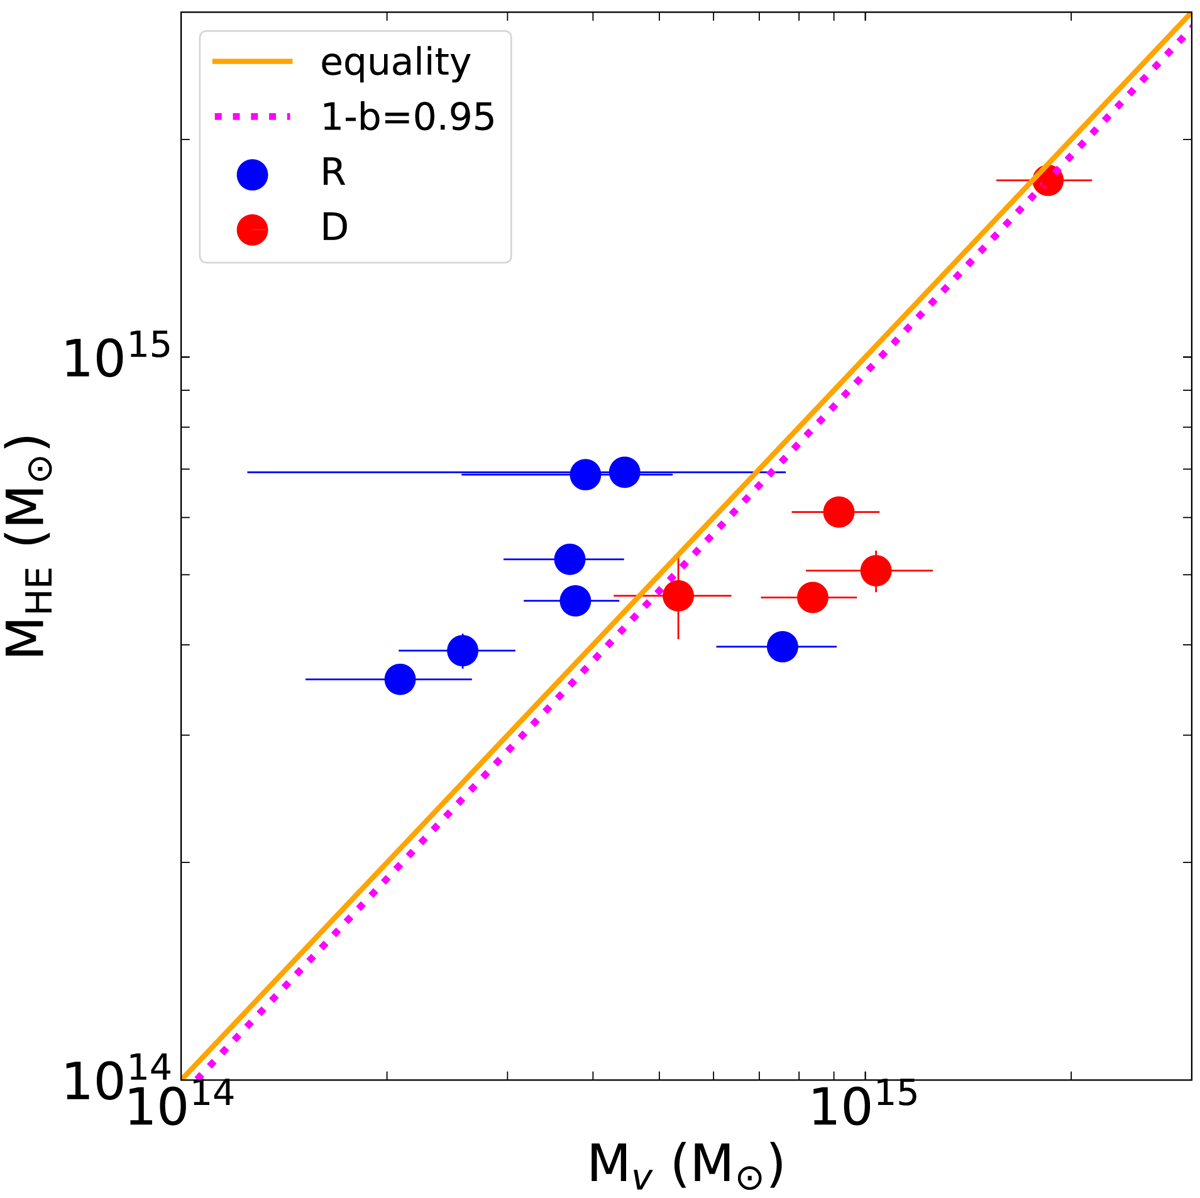
Comparison between X-ray and virial masses for the 12 HIFLUGCS clusters in common with Zhang et al. (2017). Relaxed (R) and disturbed (D) clusters are plotted with blue and red circles, respectively. The dotted magenta line represents the average MHE/Mv ratio.
Current usage metrics show cumulative count of Article Views (full-text article views including HTML views, PDF and ePub downloads, according to the available data) and Abstracts Views on Vision4Press platform.
Data correspond to usage on the plateform after 2015. The current usage metrics is available 48-96 hours after online publication and is updated daily on week days.
Initial download of the metrics may take a while.