Fig. 5.
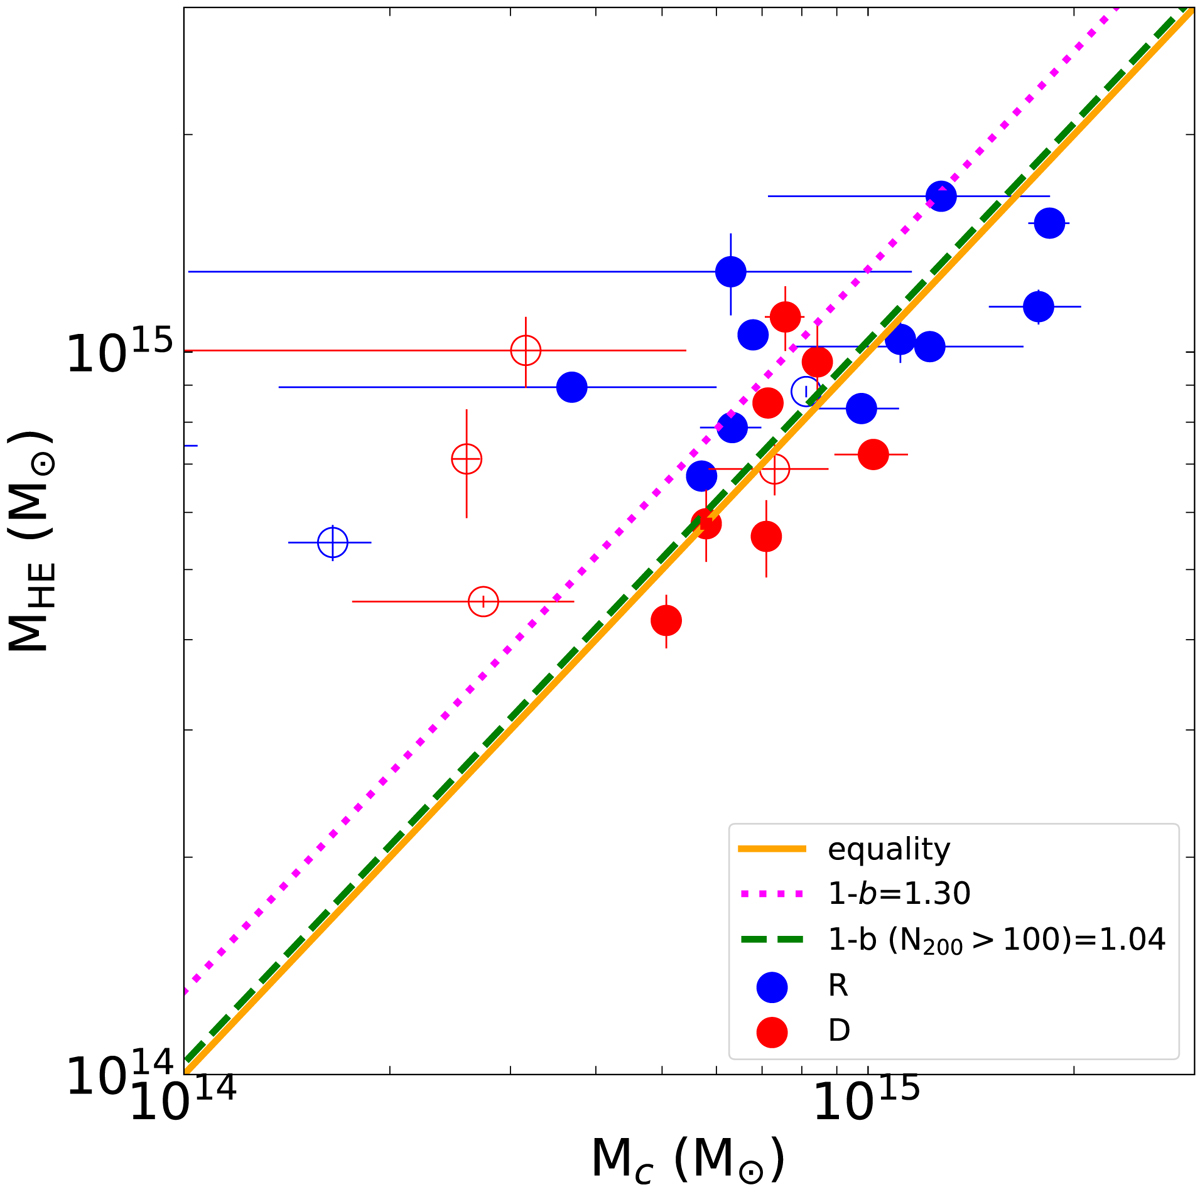
Comparison between X-ray and caustic masses for the 25 clusters in common with Sohn et al. (2020). Relaxed (R) and disturbed (D) clusters are plotted with blue and red circles, respectively. Filled and empty circles represent the clusters with N200 > 100 and N200 < 100, respectively. The dotted magenta line represents the average MHE/Mc ratio. The dashed green line represents the average MHE/Mc ratio obtained after removing the clusters with less than 100 galaxies within R200.
Current usage metrics show cumulative count of Article Views (full-text article views including HTML views, PDF and ePub downloads, according to the available data) and Abstracts Views on Vision4Press platform.
Data correspond to usage on the plateform after 2015. The current usage metrics is available 48-96 hours after online publication and is updated daily on week days.
Initial download of the metrics may take a while.