Free Access
Fig. 4.
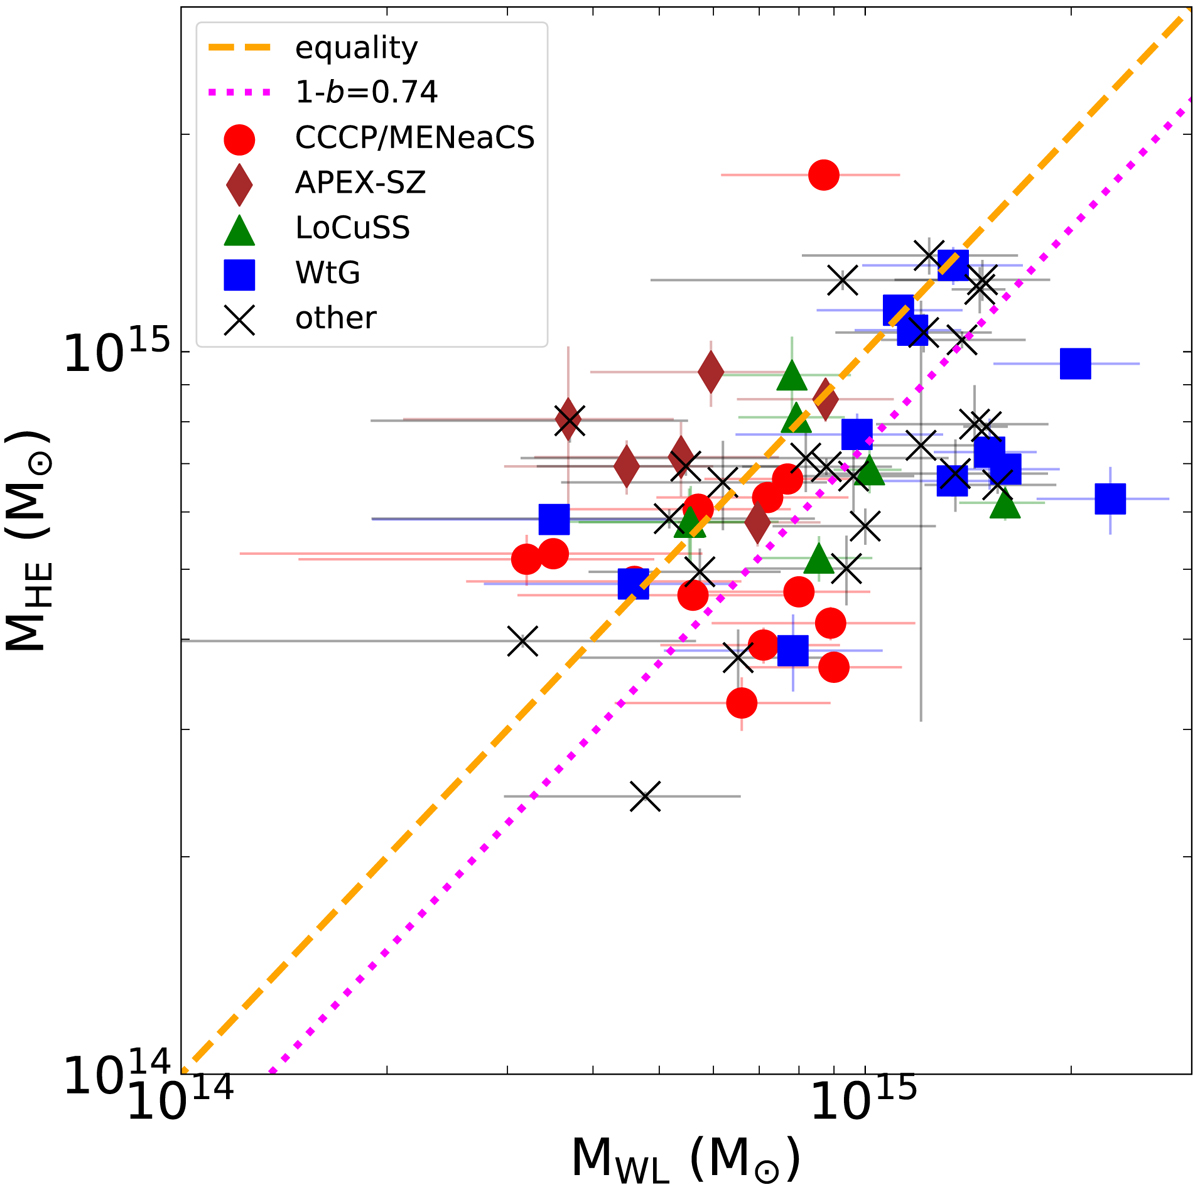
Comparison between X-ray and WL masses from LC2-single. Red circles, brown diamonds, green triangles, and blue squares represent the masses obtained by Herbonnet et al. (2020), Klein et al. (2019), Okabe & Smith (2016), and Applegate et al. (2014), respectively. The magenta line represents the average MHE/MWL ratio.
Current usage metrics show cumulative count of Article Views (full-text article views including HTML views, PDF and ePub downloads, according to the available data) and Abstracts Views on Vision4Press platform.
Data correspond to usage on the plateform after 2015. The current usage metrics is available 48-96 hours after online publication and is updated daily on week days.
Initial download of the metrics may take a while.