Fig. 6
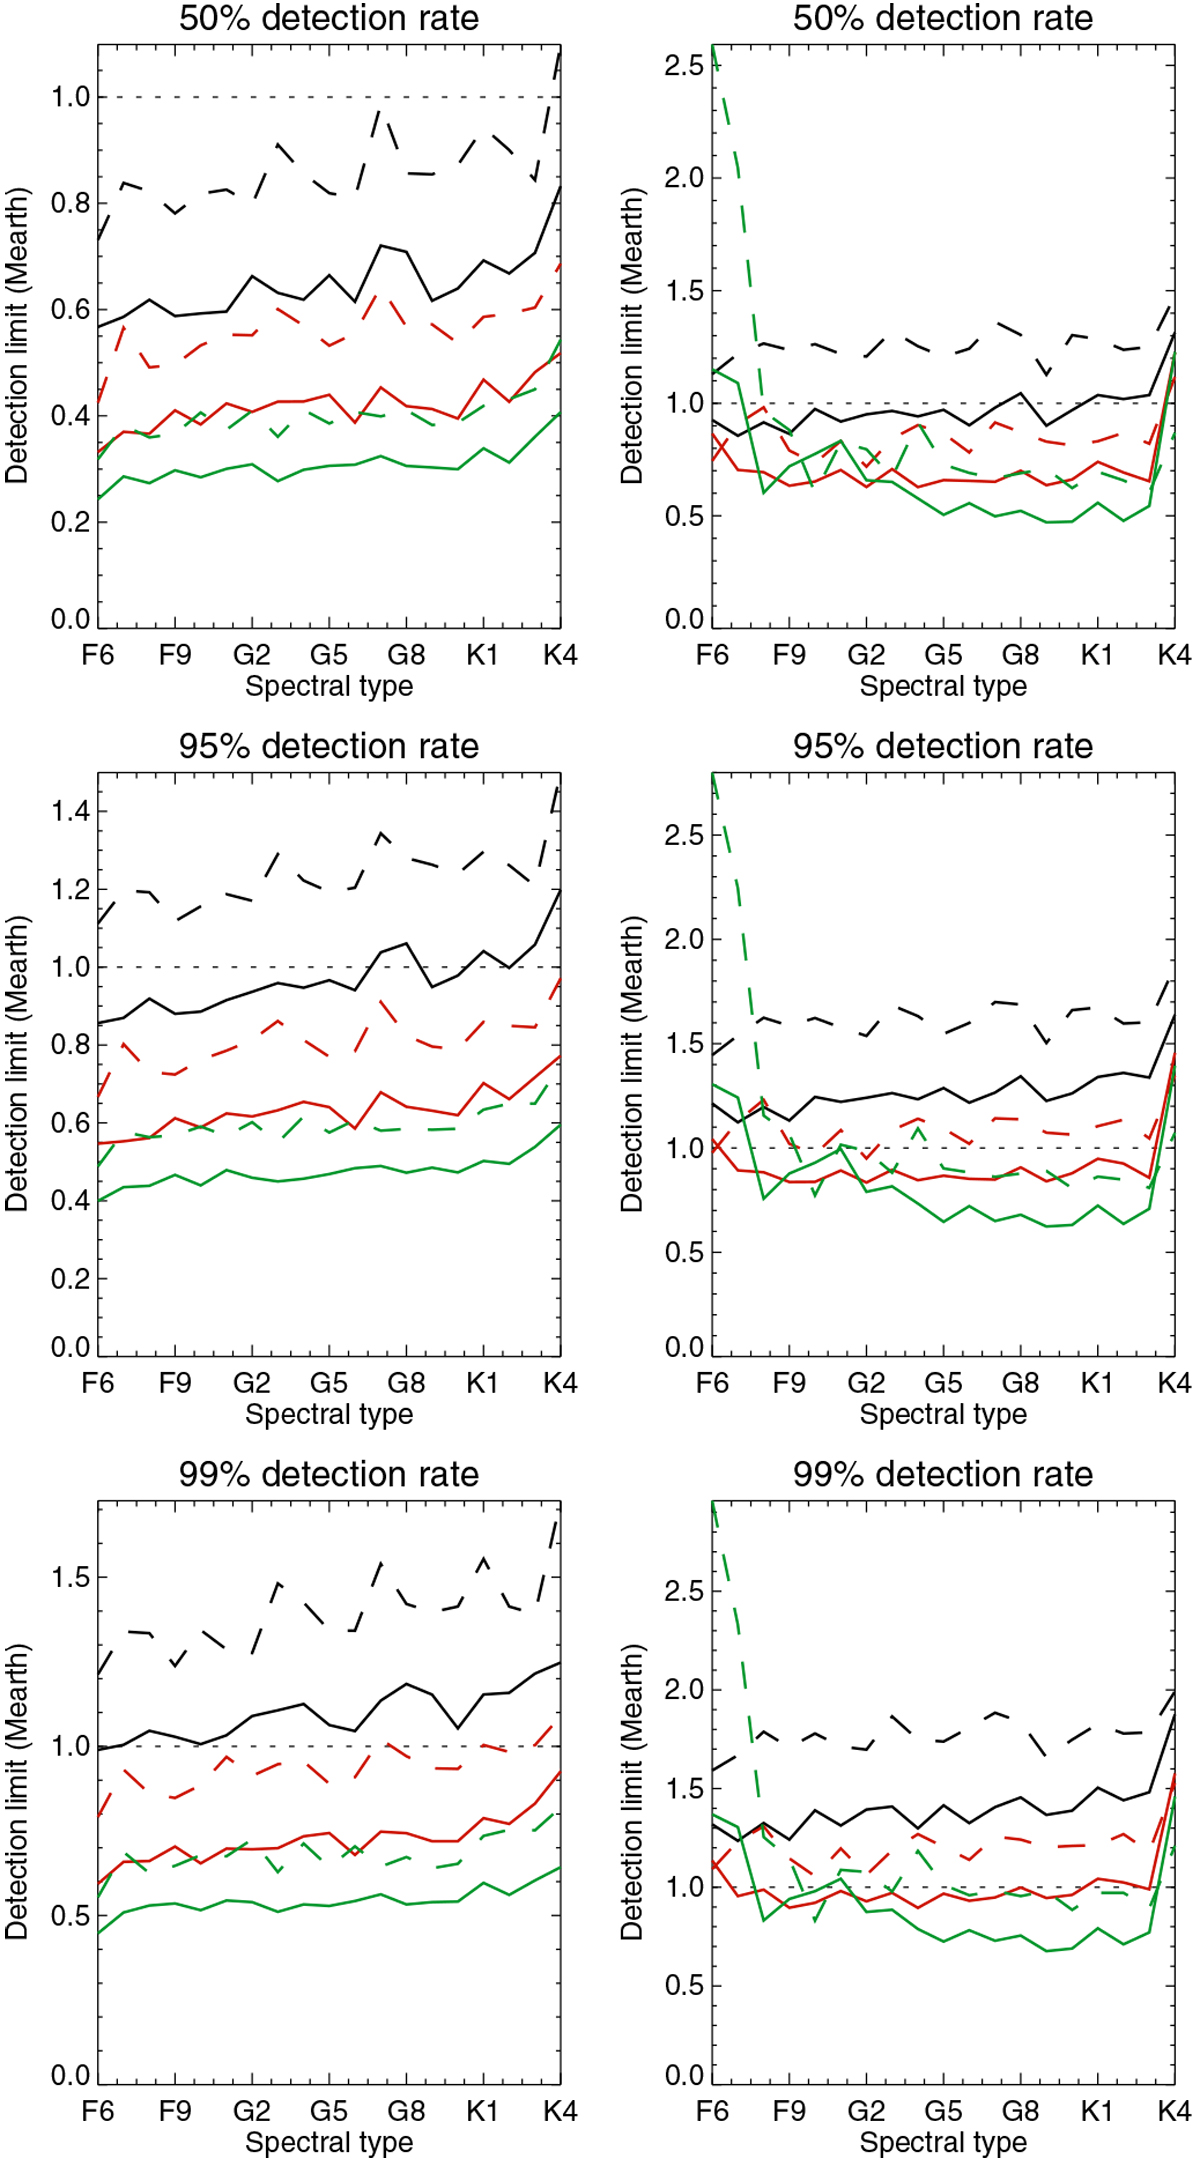
First column: detection limits based on a true fp level (based on power and frequential analysis) vs. spectral type for a 50% detection rate (first panel), for a 95% detection rate (second panel), and a for 99% detection rate (third panel). Curves are for ΔTspot1 (solid) and ΔTspot2 (dashed), and for the lower HZ (black), medium HZ (red), and upper HZ (green). Second column: same for fp based on a temporal analysis (based on mass).
Current usage metrics show cumulative count of Article Views (full-text article views including HTML views, PDF and ePub downloads, according to the available data) and Abstracts Views on Vision4Press platform.
Data correspond to usage on the plateform after 2015. The current usage metrics is available 48-96 hours after online publication and is updated daily on week days.
Initial download of the metrics may take a while.