Fig. 3
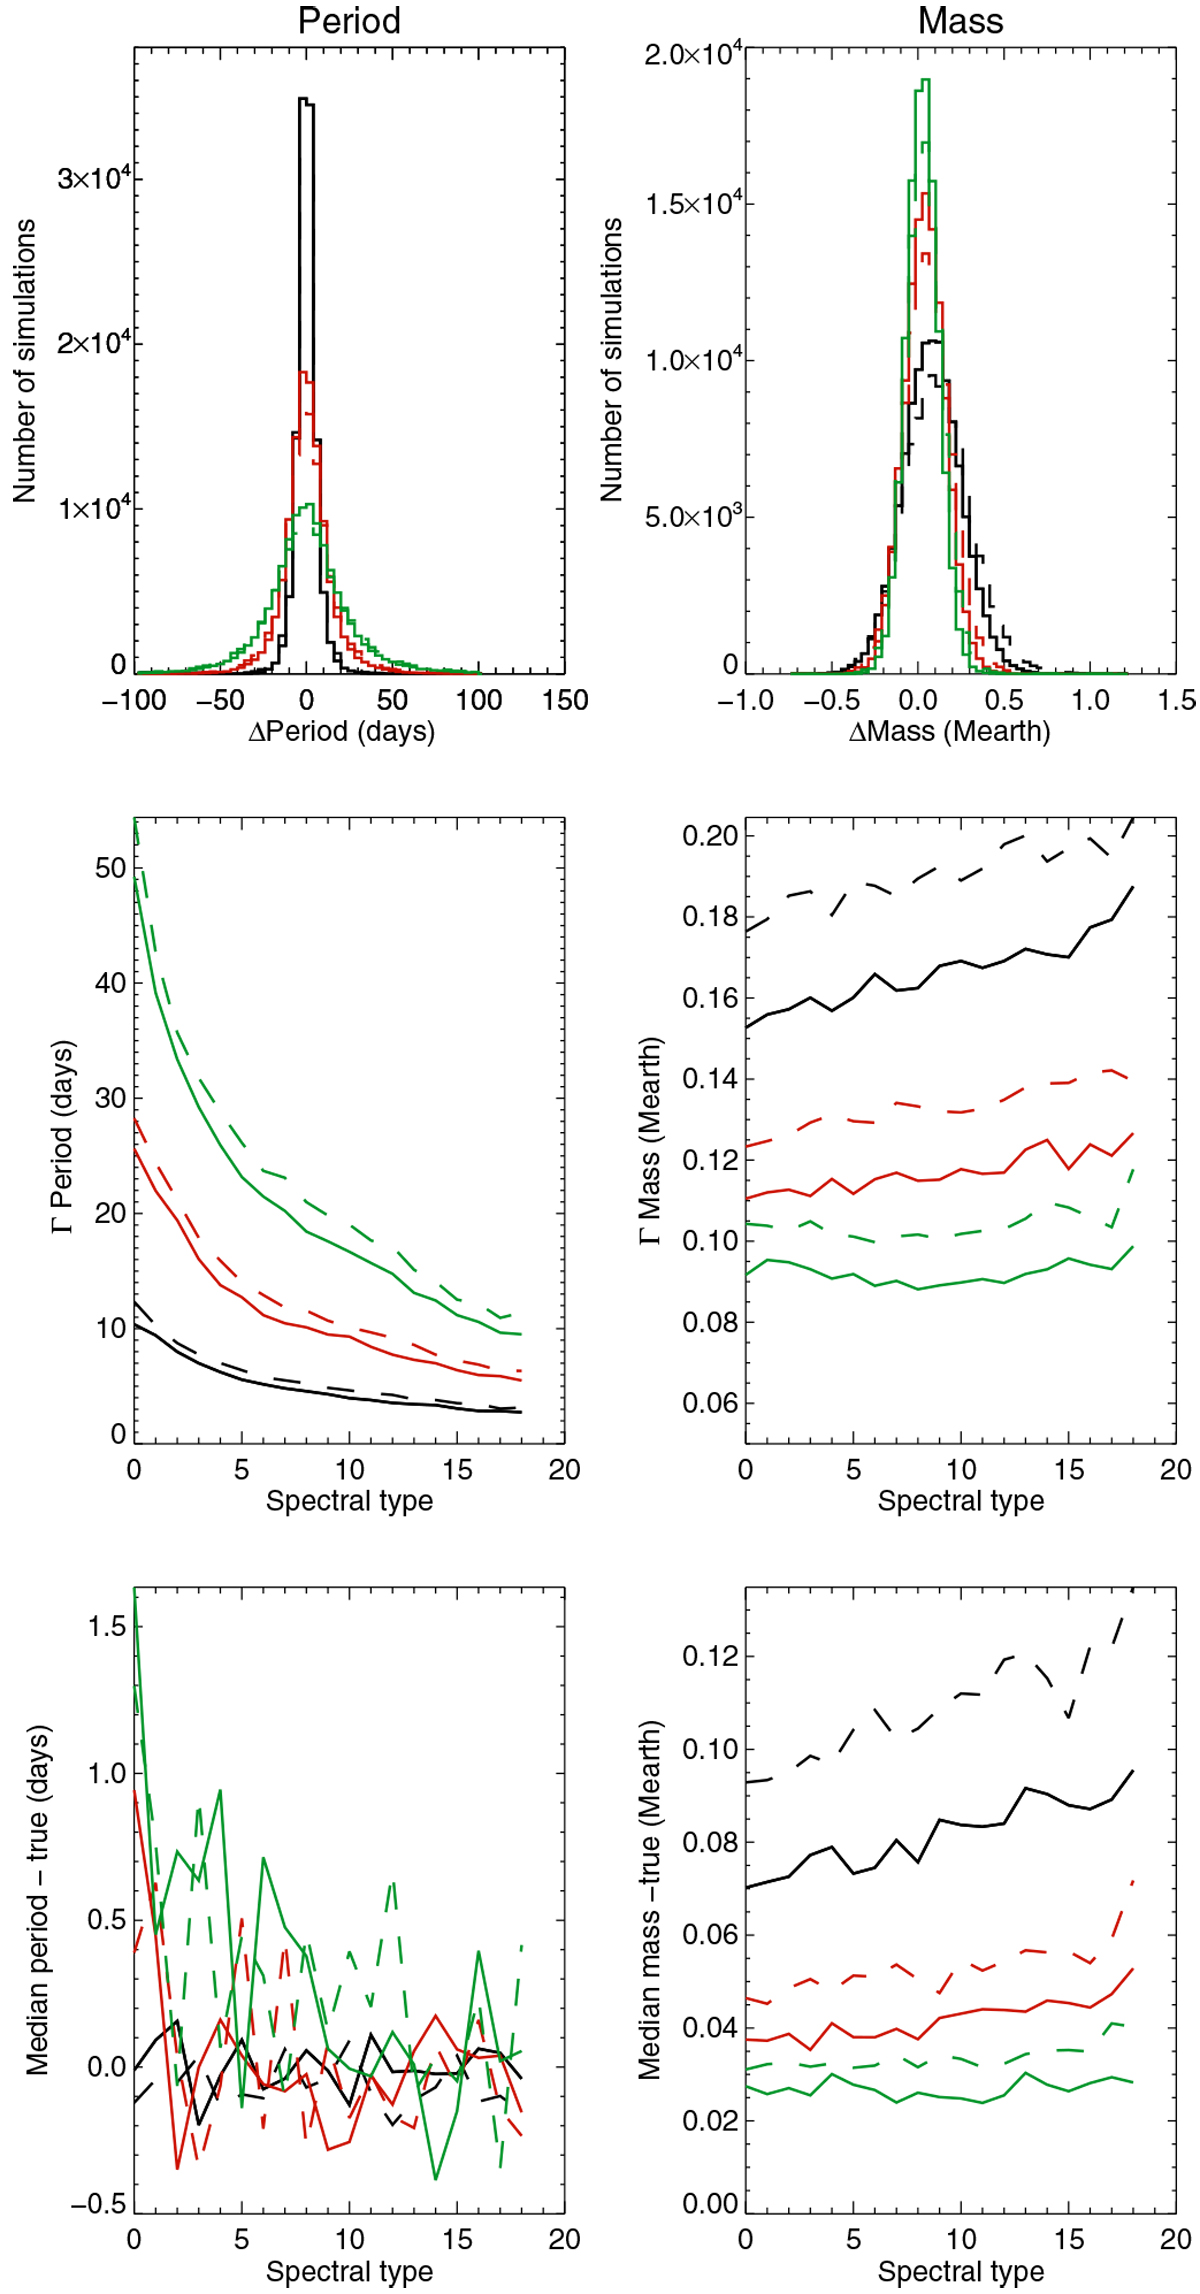
Left panels: distribution of the difference between fitted period and true period for ΔTspot1 (solid) and ΔTspot2 (dashed), and for the lower HZ (black), medium HZ (red), and upper HZ (green) for all simulations (and therefore all spectral types), the distribution width for all simulations vs. spectral types, and the median of the difference between fitted and true period vs. spectral type. Right panels: same for the mass.
Current usage metrics show cumulative count of Article Views (full-text article views including HTML views, PDF and ePub downloads, according to the available data) and Abstracts Views on Vision4Press platform.
Data correspond to usage on the plateform after 2015. The current usage metrics is available 48-96 hours after online publication and is updated daily on week days.
Initial download of the metrics may take a while.