Fig. F.1
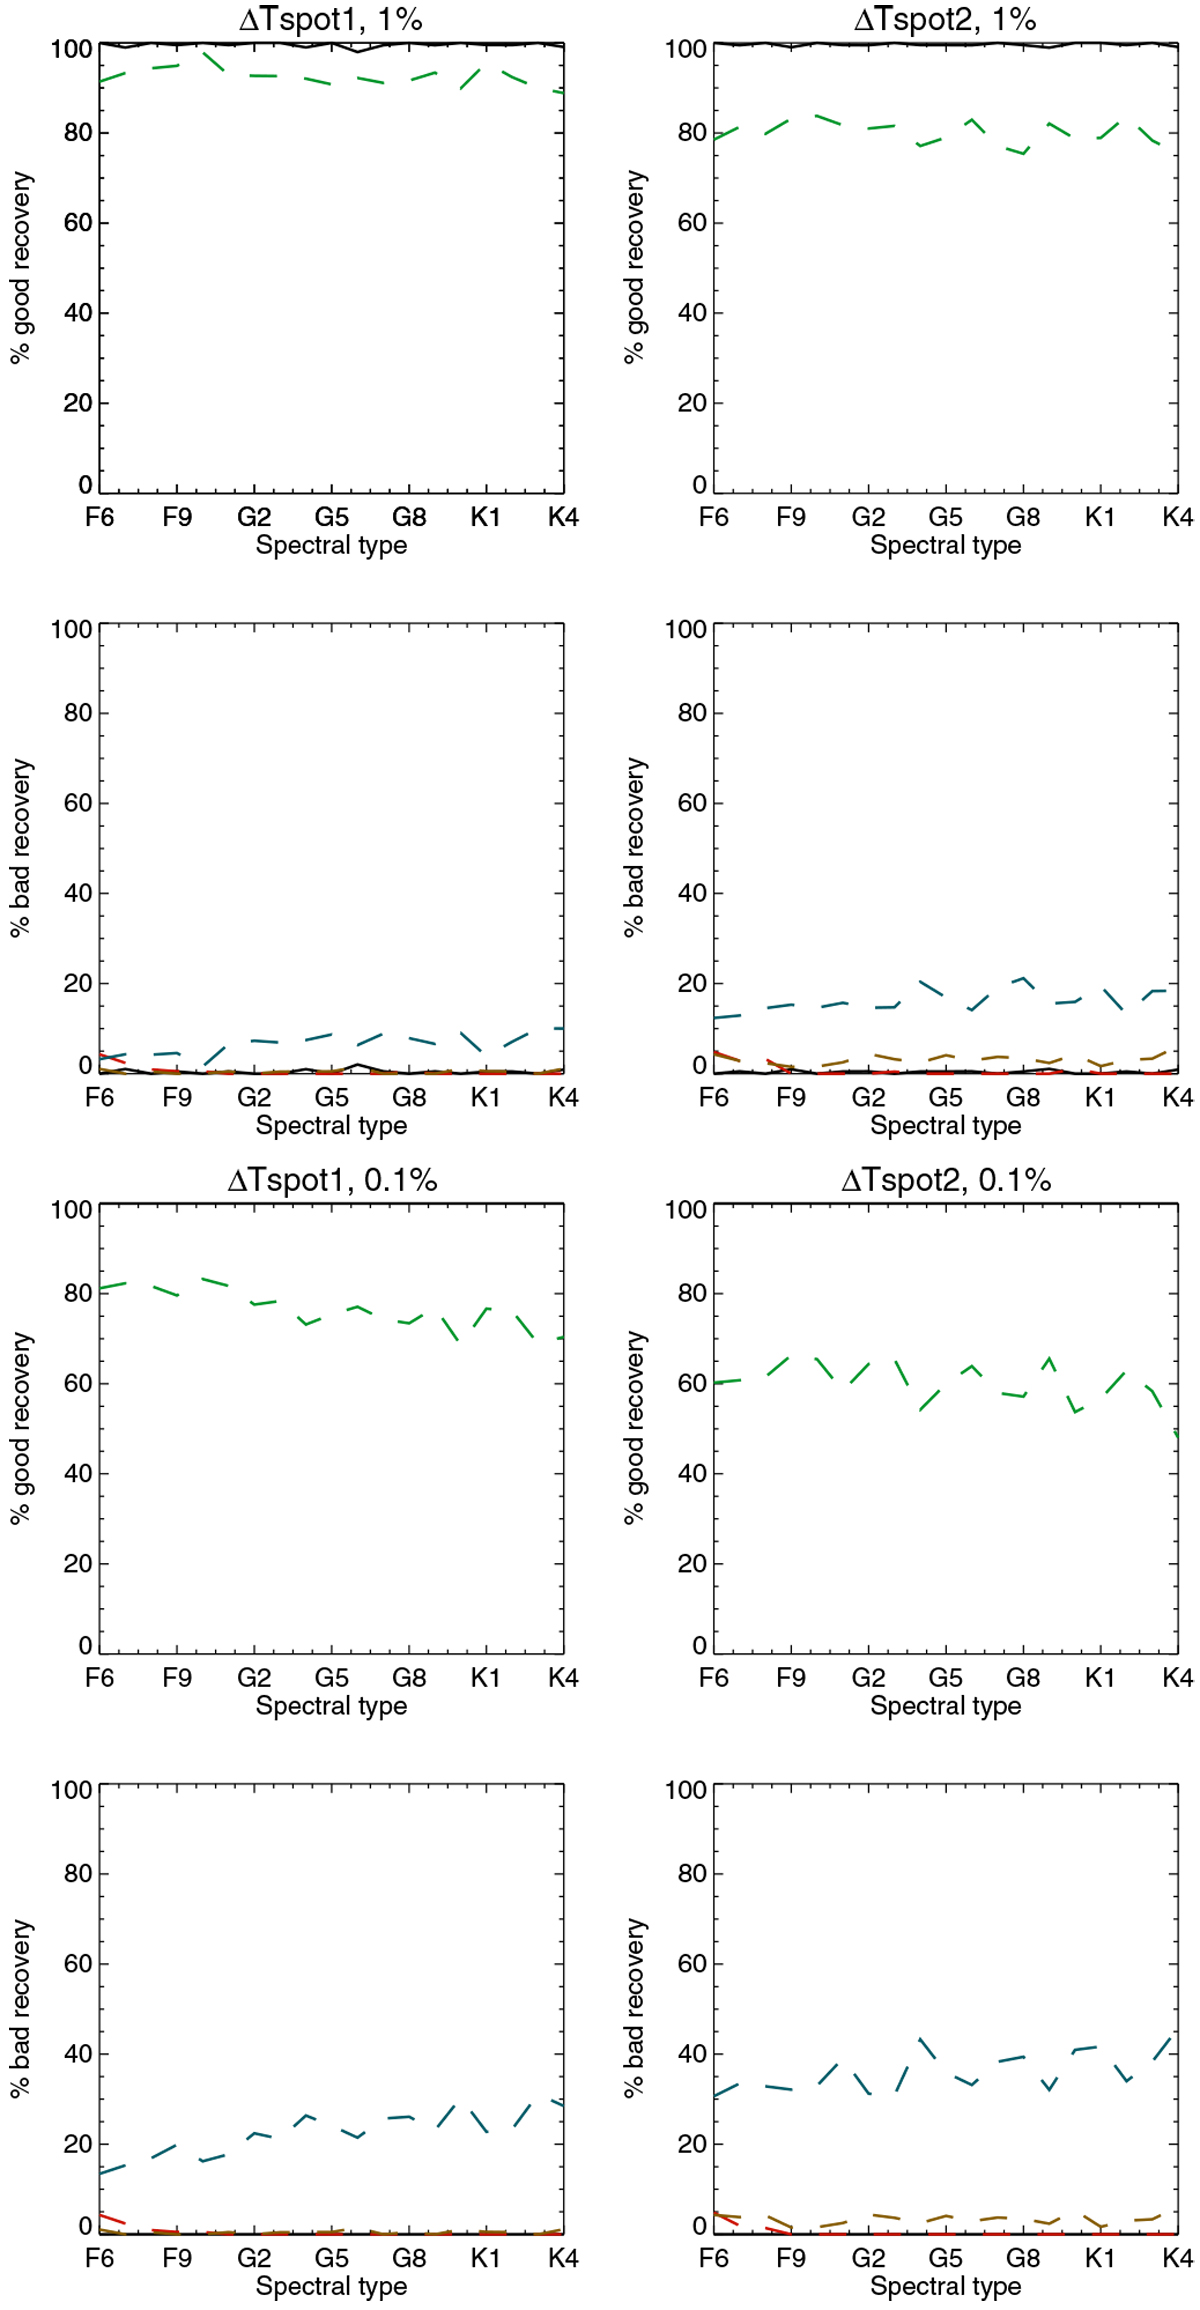
Percentage of good and poor recovery rates vs. spectral type for 1% FAP level (two first rows) and 0.1% FAP level (two last rows) from blind tests A. The good recovery rates correspond to the case without a planet (solid black line) and with a planet (dashed green line). The poor recovery rates correspond to the case without a planet (solid black line, false positive) and with a planet: incorrect planets (red dashed line, false positive), rejected planets (blue dashed line), and missed planets (brown dashed line). In the third row all curves except one are at the 100% level, and most poor recovery curves are close to 0%.
Current usage metrics show cumulative count of Article Views (full-text article views including HTML views, PDF and ePub downloads, according to the available data) and Abstracts Views on Vision4Press platform.
Data correspond to usage on the plateform after 2015. The current usage metrics is available 48-96 hours after online publication and is updated daily on week days.
Initial download of the metrics may take a while.