Fig. E.2
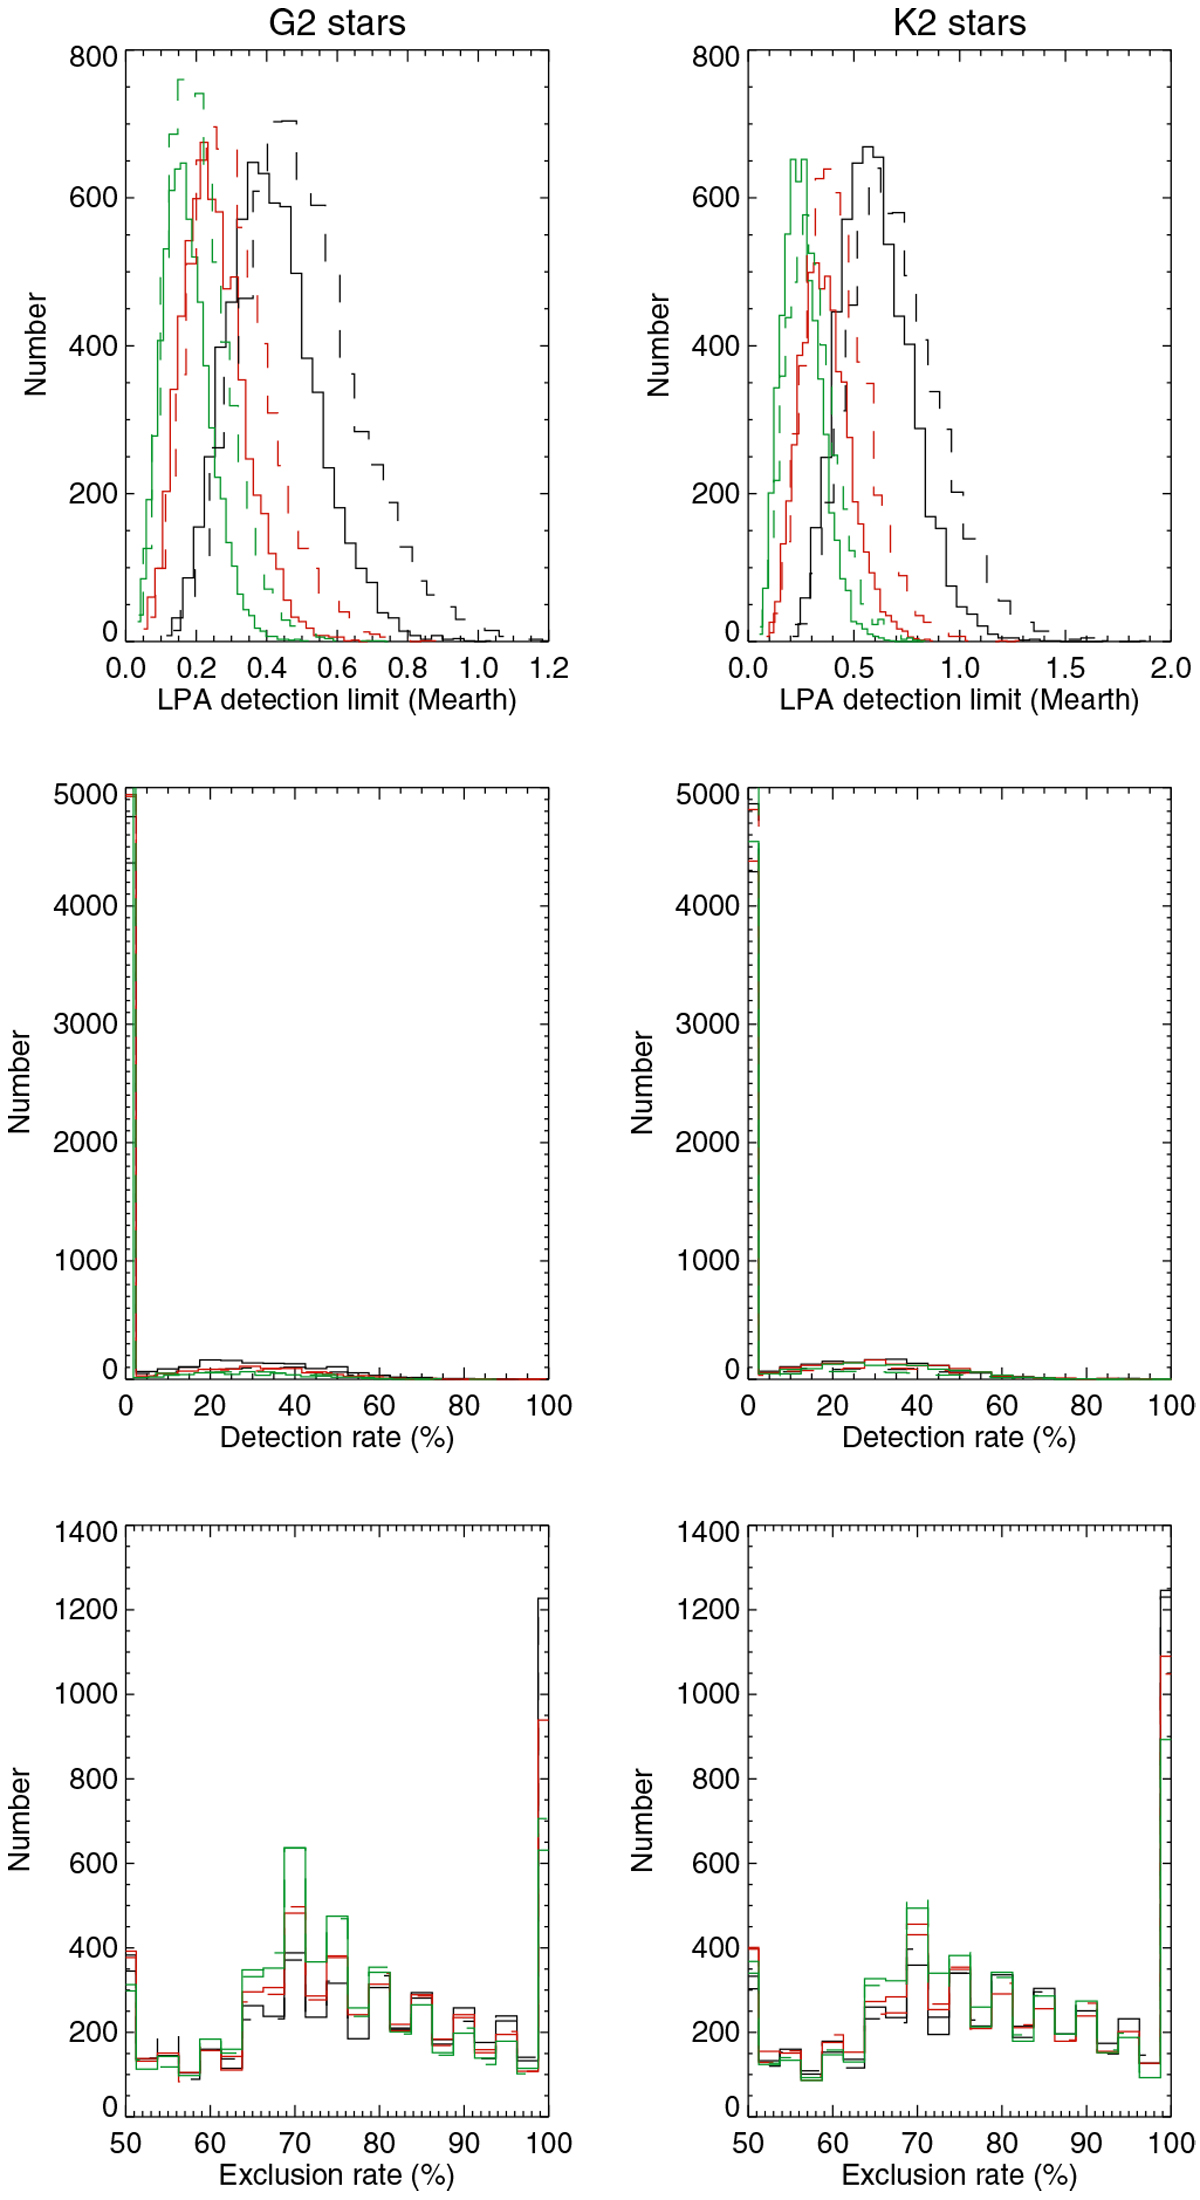
LPA caracterisation for G2 stars (left) and K2 stars (right). First row: distribution of the LPA detection limits for ΔTspot1 (solid lines) and ΔTspot2 (dashed lines) for the different HZ periods: lower HZ (black), medium HZ (red), and upper HZ (green). Third row: same for the distribution of the detection rates corresponding to the LPA masses. Fourth row: same for the distribution of exclusion rates corresponding to the LPA masses.
Current usage metrics show cumulative count of Article Views (full-text article views including HTML views, PDF and ePub downloads, according to the available data) and Abstracts Views on Vision4Press platform.
Data correspond to usage on the plateform after 2015. The current usage metrics is available 48-96 hours after online publication and is updated daily on week days.
Initial download of the metrics may take a while.