Open Access
Fig. E.1
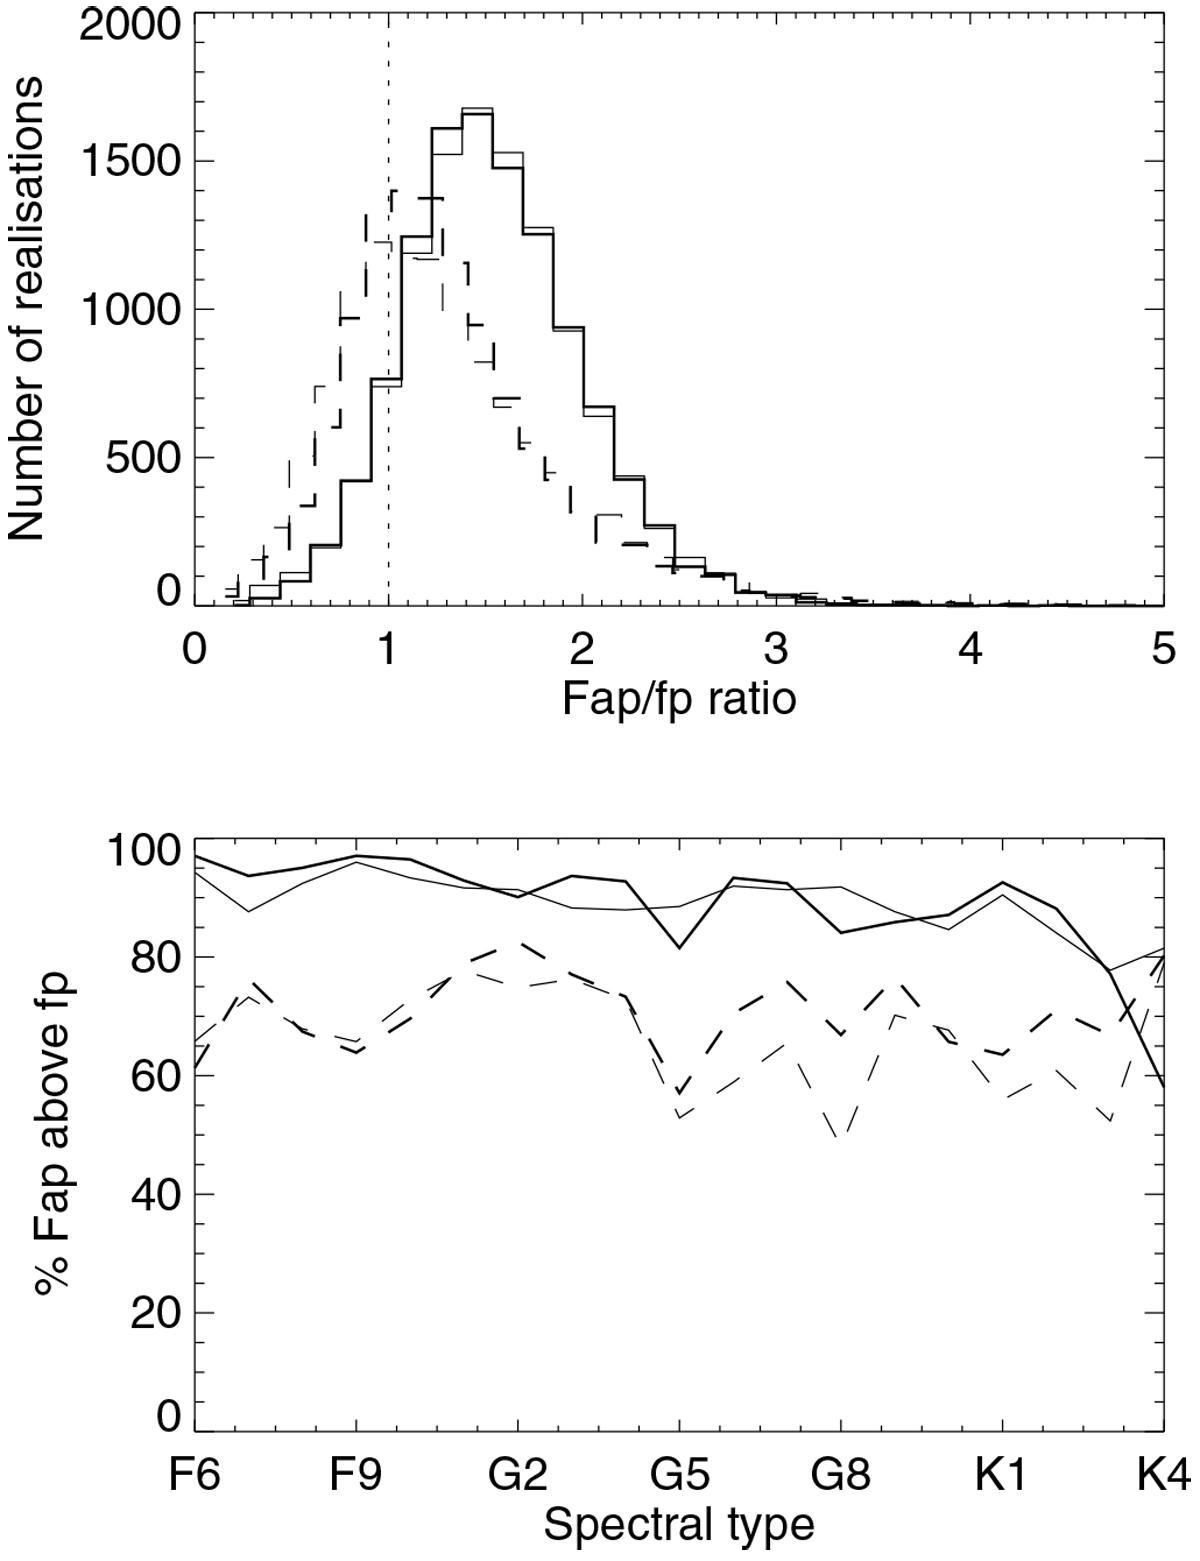
Distribution of the FAP/fp ratio (upper panel), and percentage of simulations for which the FAPis higher than the fp (lower panel) vs. spectral type. The solid lines correspond to ΔTspot1 and the dashed lines to ΔTspot2. The thin lines are for a constant fp and the thick lines for an fp dependent on stellar variability.
Current usage metrics show cumulative count of Article Views (full-text article views including HTML views, PDF and ePub downloads, according to the available data) and Abstracts Views on Vision4Press platform.
Data correspond to usage on the plateform after 2015. The current usage metrics is available 48-96 hours after online publication and is updated daily on week days.
Initial download of the metrics may take a while.