Fig. D.1
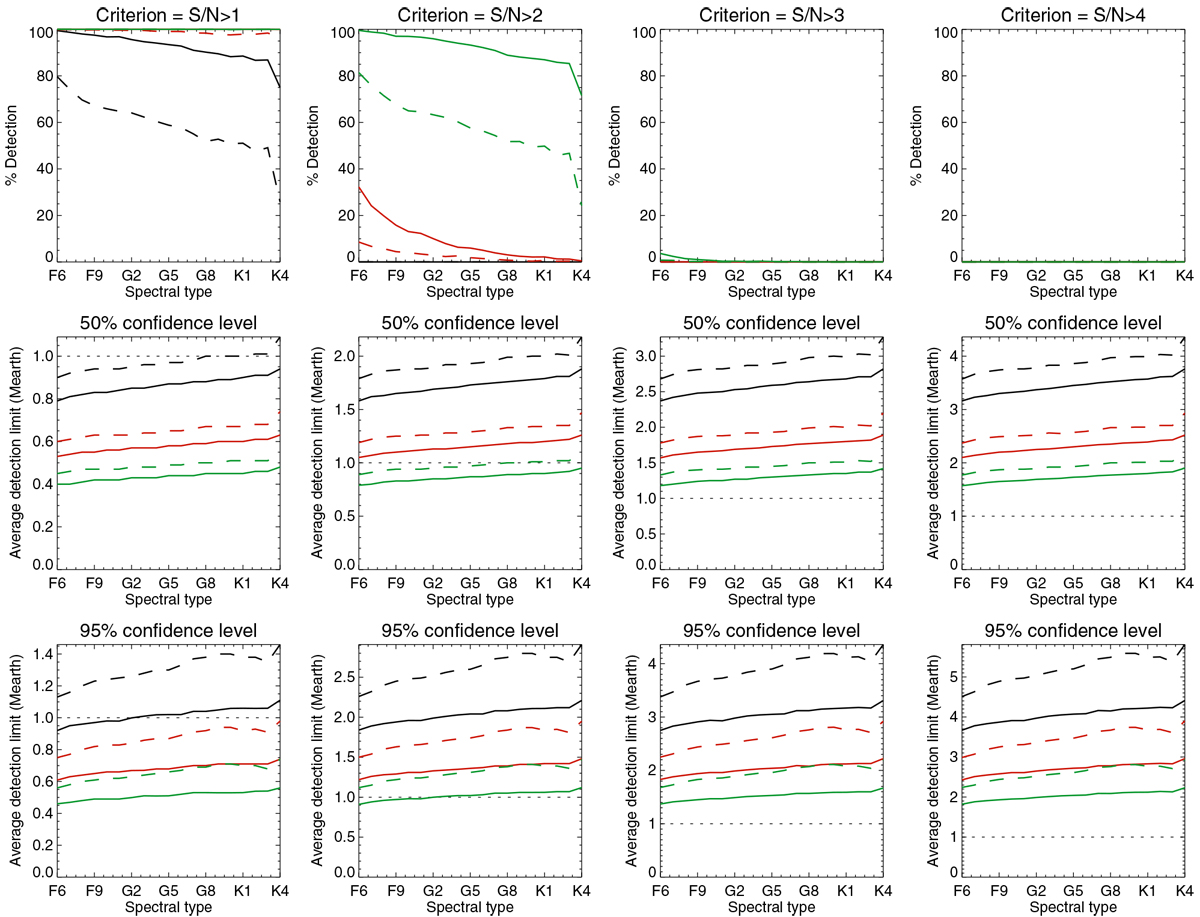
First row: detection rate vs. spectral type deduced from different S/N thresholds (from left to right: 1, 2, 3, and 4) for ΔTspot1 (solid) and ΔTspot2 (dashed) for a 1 MEarth planet at different orbital periods: lower HZ (black), medium HZ (red), and upper HZ (green). Curves that are not visible are at the 100% level S/N thresholds 1 and 2, and at the 0% level for thresholds of 3 and 4. Second row: mass detection limit with a 50% confidence level for the same criteria (same colour and line code). Third row: same with a 95% confidence level.
Current usage metrics show cumulative count of Article Views (full-text article views including HTML views, PDF and ePub downloads, according to the available data) and Abstracts Views on Vision4Press platform.
Data correspond to usage on the plateform after 2015. The current usage metrics is available 48-96 hours after online publication and is updated daily on week days.
Initial download of the metrics may take a while.