Fig. C.5
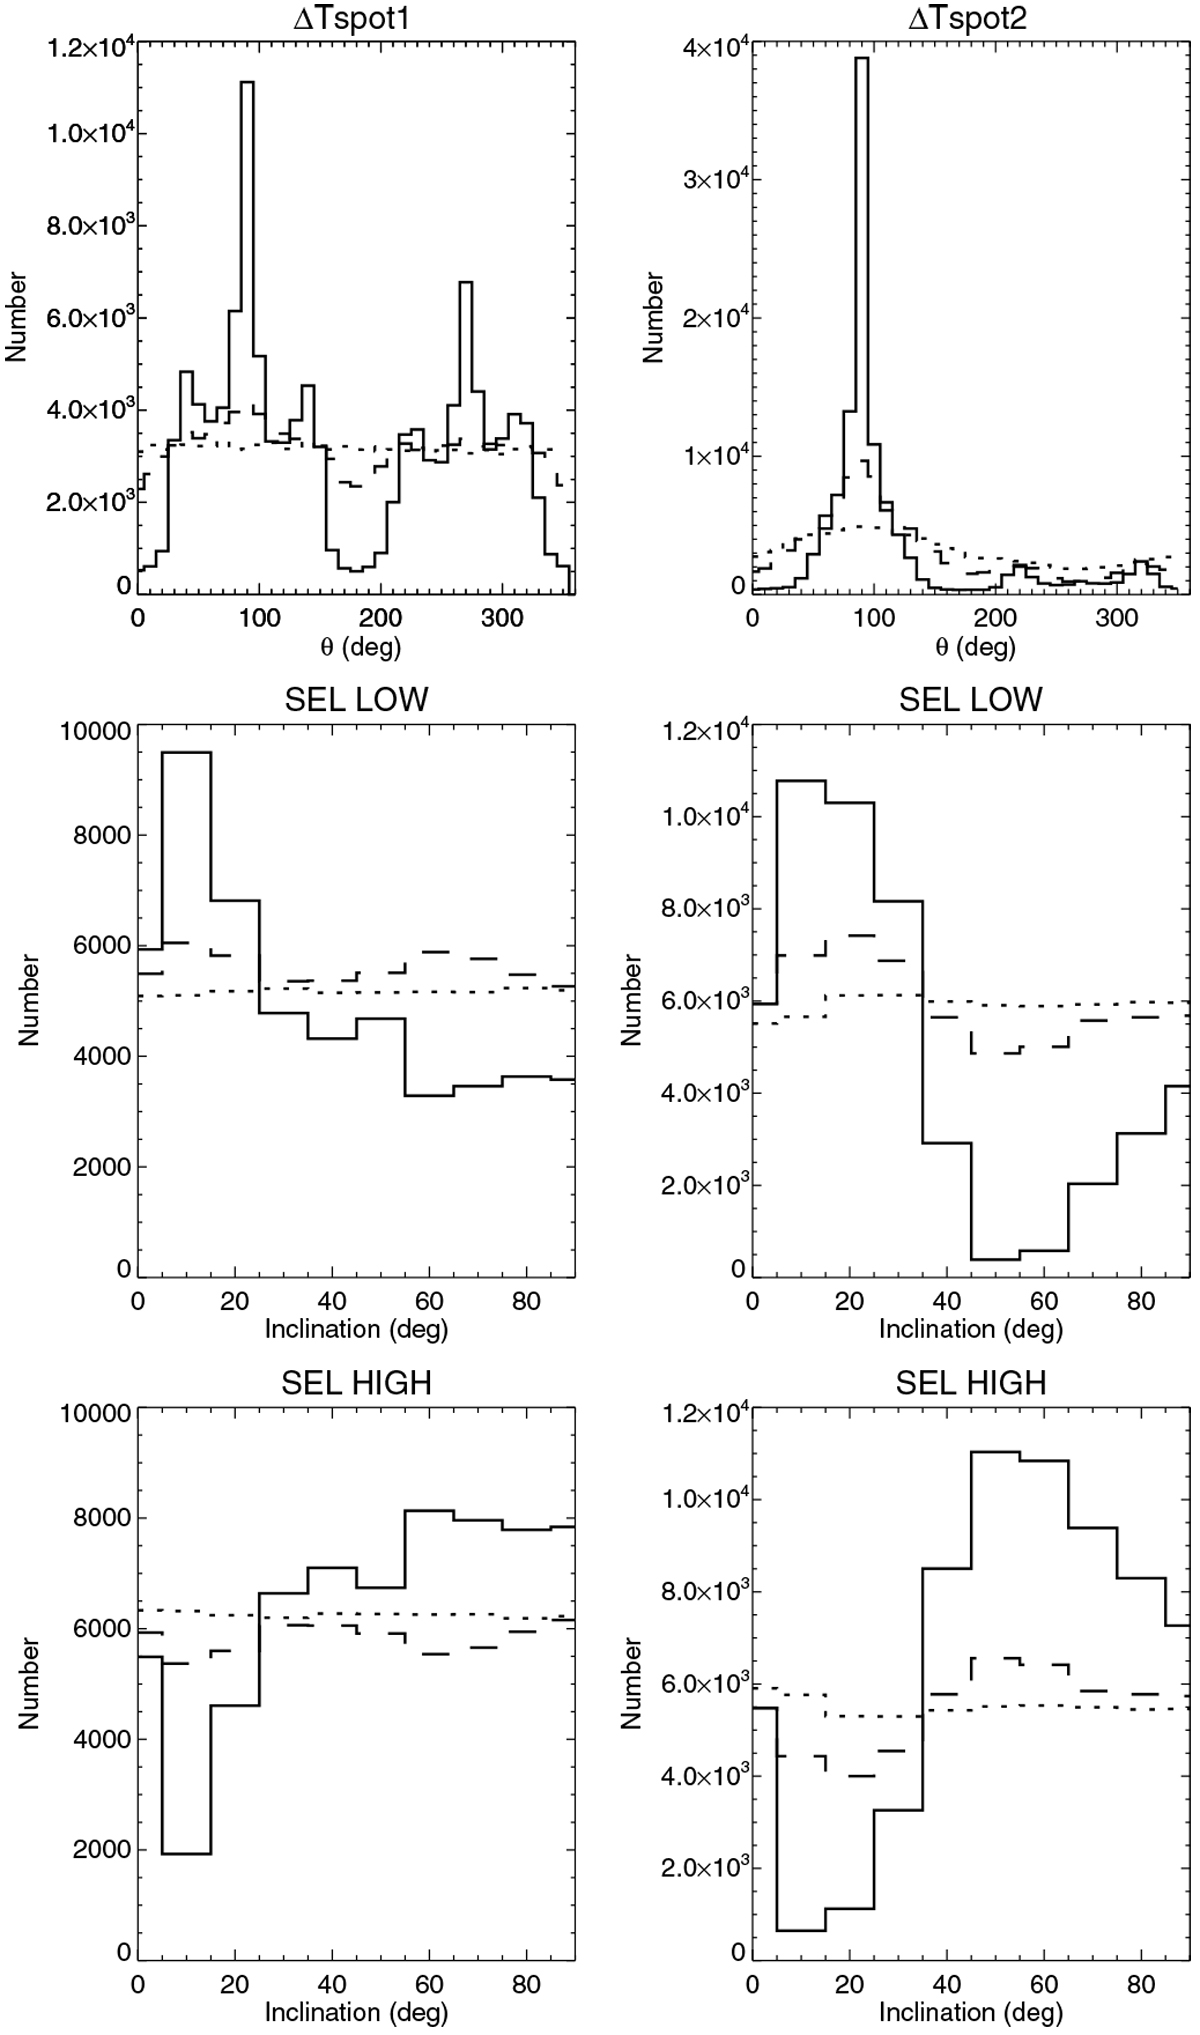
Left column, from top to bottom: distribution of different variables characterising activity for ΔTspot1 and for different time series: complete without noise (solid lines), degraded sampling without noise (dashed lines), and degraded sampling with noise (dotted lines). Variables are the angle at which the skewness is highest (90° and 270° represent the Y direction), inclination for simulations in which the rms in this direction is higher than in the orthogonal direction, and inclination for simulations in which the rms in this direction is lower than in the orthogonal direction. Right column: same for ΔTspot2.
Current usage metrics show cumulative count of Article Views (full-text article views including HTML views, PDF and ePub downloads, according to the available data) and Abstracts Views on Vision4Press platform.
Data correspond to usage on the plateform after 2015. The current usage metrics is available 48-96 hours after online publication and is updated daily on week days.
Initial download of the metrics may take a while.