Fig. C.4
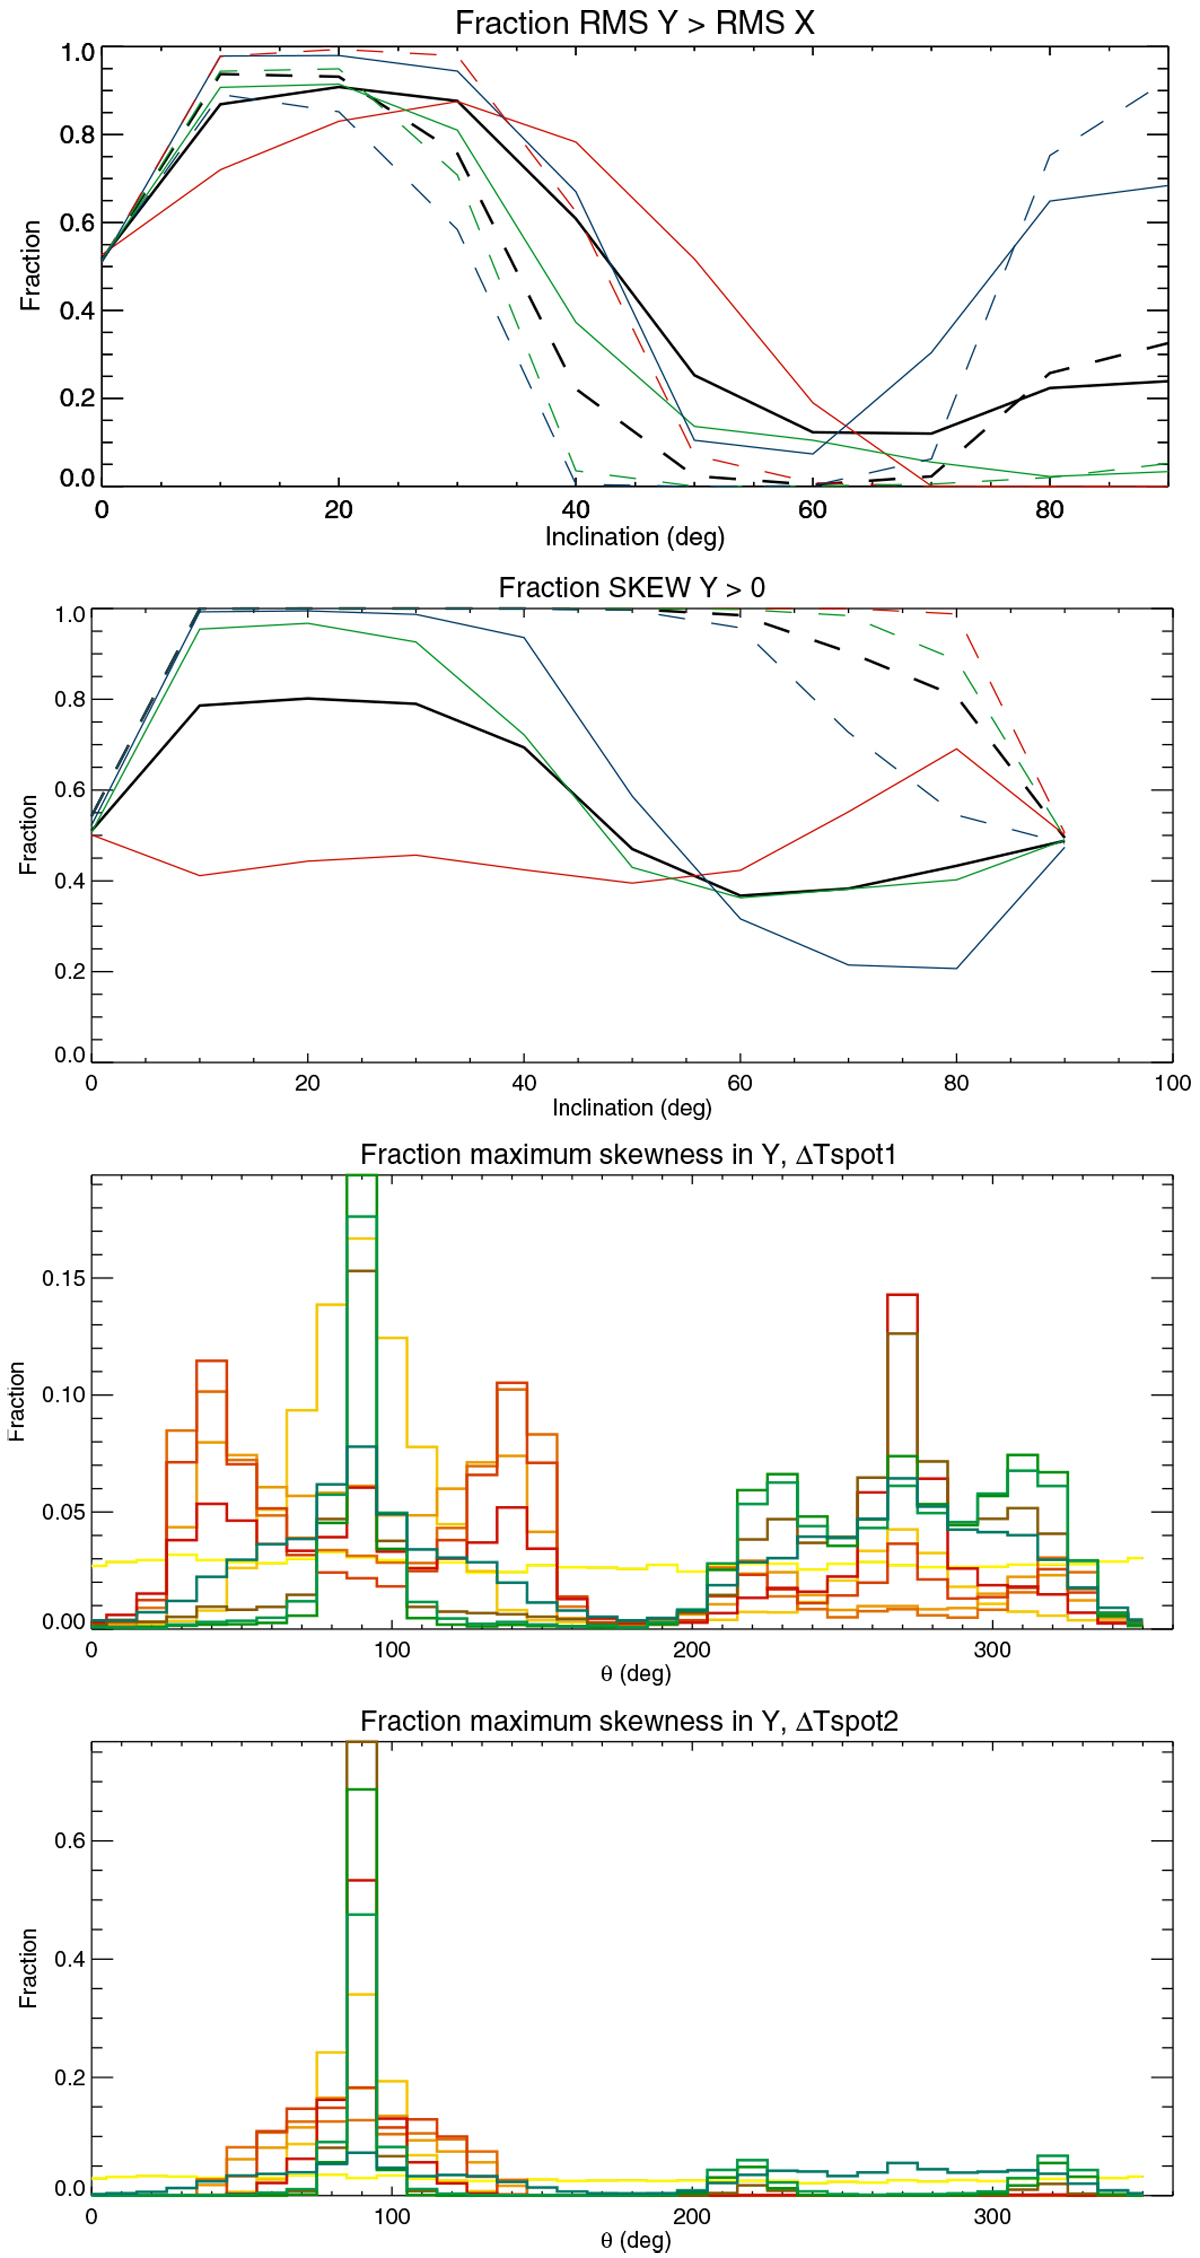
First panel: fraction of simulations in which the rms is higher in Y than in X direction for ΔTspot1 (solid) and ΔTspot2 (dashed). The colour code represents different θmax values: solar (red), solar+10° (green), solar+20° (blue), and all (black). Second panel: same for the fraction of simulations with a positive skewness in the Y direction. Third panel: distribution of the angles at which the skewness in Y is highest (ΔTspot1 only) for the ten inclinations (same colour code as Fig. 3). Fourth panel: same for ΔTspot2.
Current usage metrics show cumulative count of Article Views (full-text article views including HTML views, PDF and ePub downloads, according to the available data) and Abstracts Views on Vision4Press platform.
Data correspond to usage on the plateform after 2015. The current usage metrics is available 48-96 hours after online publication and is updated daily on week days.
Initial download of the metrics may take a while.