Fig. 2
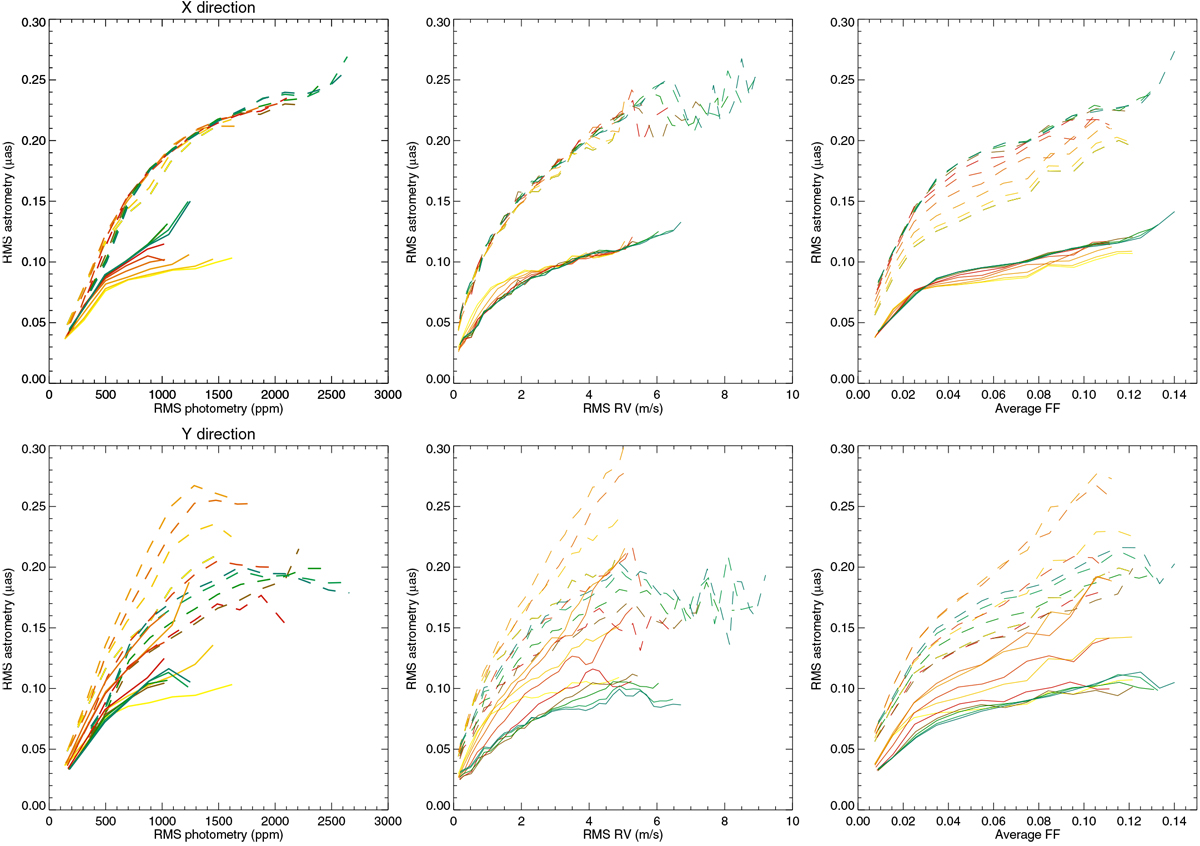
Upper panels: average rms of the astrometric signal in the X direction vs. rms of photometric signal (left), rms of RV signal (middle), and average filling factor (right), for the ten inclinations (colour code as in Fig. 1) and all spectral types. Solid curves represent ΔTspot1 simulations, and dashed lines represent ΔTspot2 simulations. Lower panels: same for the Y direction.
Current usage metrics show cumulative count of Article Views (full-text article views including HTML views, PDF and ePub downloads, according to the available data) and Abstracts Views on Vision4Press platform.
Data correspond to usage on the plateform after 2015. The current usage metrics is available 48-96 hours after online publication and is updated daily on week days.
Initial download of the metrics may take a while.