Open Access
Fig. C.3
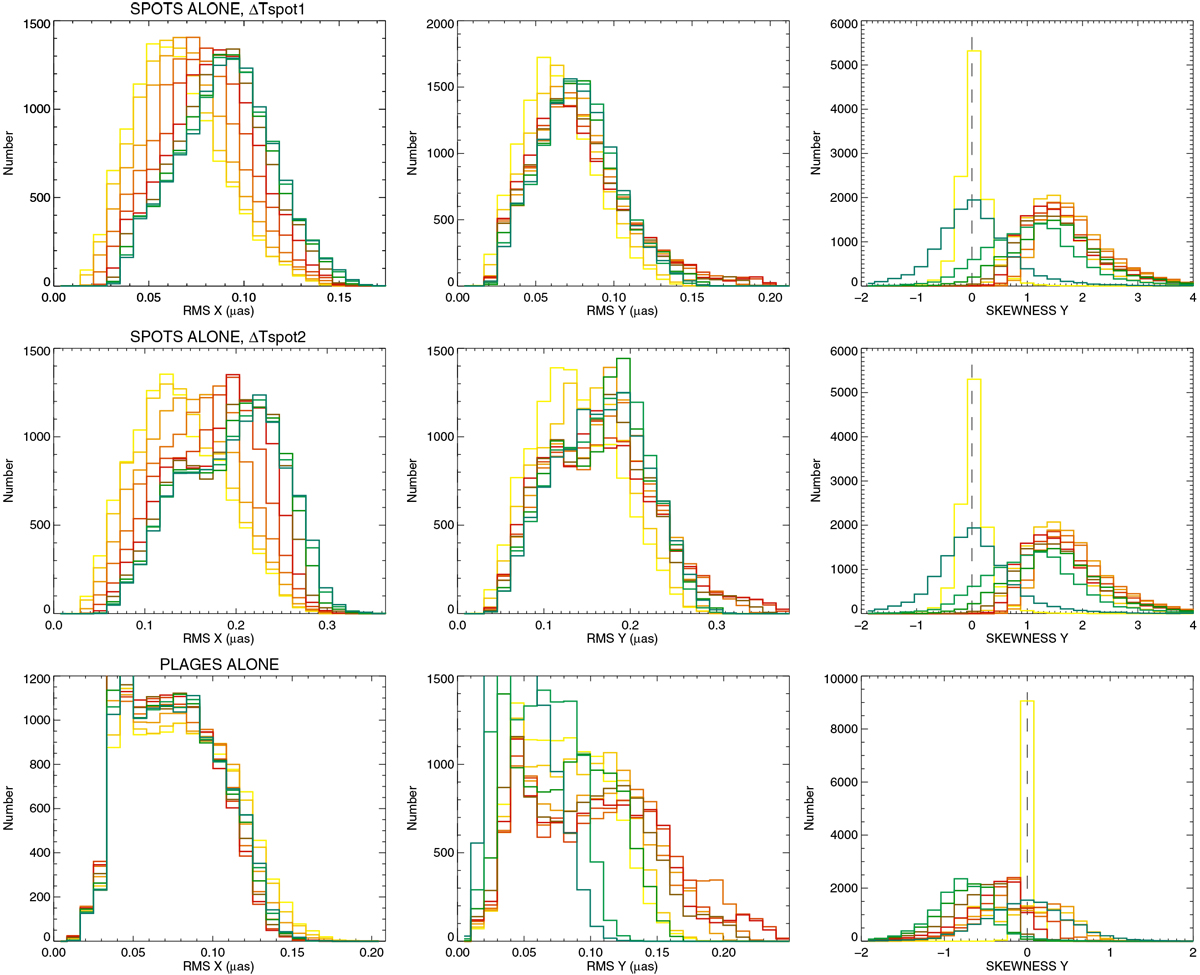
Distribution of rms in the X direction (left), of rms in the Y direction (middle) and of skewness in the Y direction (right) for ten inclinations (the colour code is similar to Fig. 1) for different contributions: spots with ΔTspot1 (upper panels), spots alone ΔTspot2 (middle panels), and plages alone (lower panels).
Current usage metrics show cumulative count of Article Views (full-text article views including HTML views, PDF and ePub downloads, according to the available data) and Abstracts Views on Vision4Press platform.
Data correspond to usage on the plateform after 2015. The current usage metrics is available 48-96 hours after online publication and is updated daily on week days.
Initial download of the metrics may take a while.